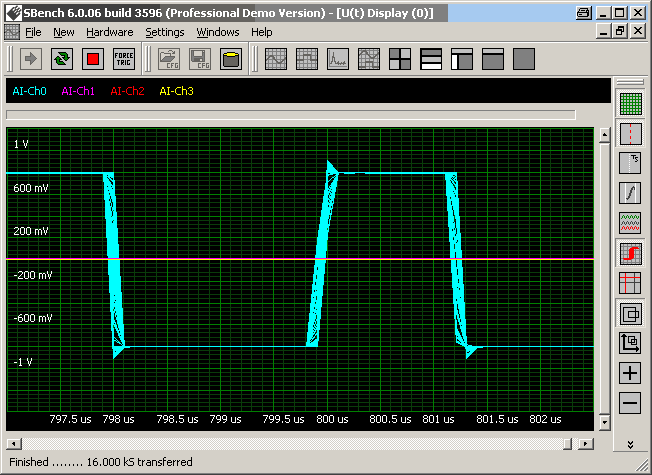
 The history mode allows to plot several shots of the same signal over each other. This shows signal variation and signal exceptions without doing additional analysis or complicated checking routines. A simple display screen shows all the variations and exceptions helping to find problems in the signal or worst case scenarios. The measurement cursors can be used to quantify variations or to measure single exception signals directly.
This is for example very helpful when analyzing digital data streams. A history plot over several shots will show a characteristic eye diagram of the signal allowing to analyze the data signal concerning noise, distortion and phase jitter.