Modular digitizers are typically small compact devices that allow the capture and conversion of analog electronic signals into digital data. The data can then be stored in on-board memory or transferred to a PC. As digitizers are "blind" instruments they do not normally have an integral display to view, measure or analyze the data they collect. Instead, these functions are usually performed by a PC. Thanks to today's technology PC's offer massive amounts of processing power, large displays and huge storage capabilities. Notebook PC's can even be used to provide easy portability in remote or mobile applications.
 In order to work with a PC all digitizer manufacturers provide some form of software that allows immediate control of the digitizer and viewing of the data it generates. Spectrum supplies a fully featured program called SBench 6. The program provides the ability to control and view the waveforms acquired by the digitizer and can perform both simple and complex measurements along with multiple analysis tools. SBench 6 supports all Spectrum digitizer families including the digitizerNETBOX and is a powerful application for verifying the operation of the digitizer right out of the box. It also allows the user to confirm the digitizer's operation during the development of their own custom software as well as serving as an offline station for reviewing and analyzing data.
What is SBench 6?
SBench 6 is a fast and easy to use data acquisition software package, running under either Windows or Linux, which supports Spectrum digitizers. It provides complete control of the Spectrum hardware and viewing, logging and post processing of captured analog or digital signals using a familiar Windows based user interface. The interface eliminates the need for text programming in order to use the digitizer hardware. The program is offered in a basic and professional version, the following application note deals with the professional version of SBench 6.
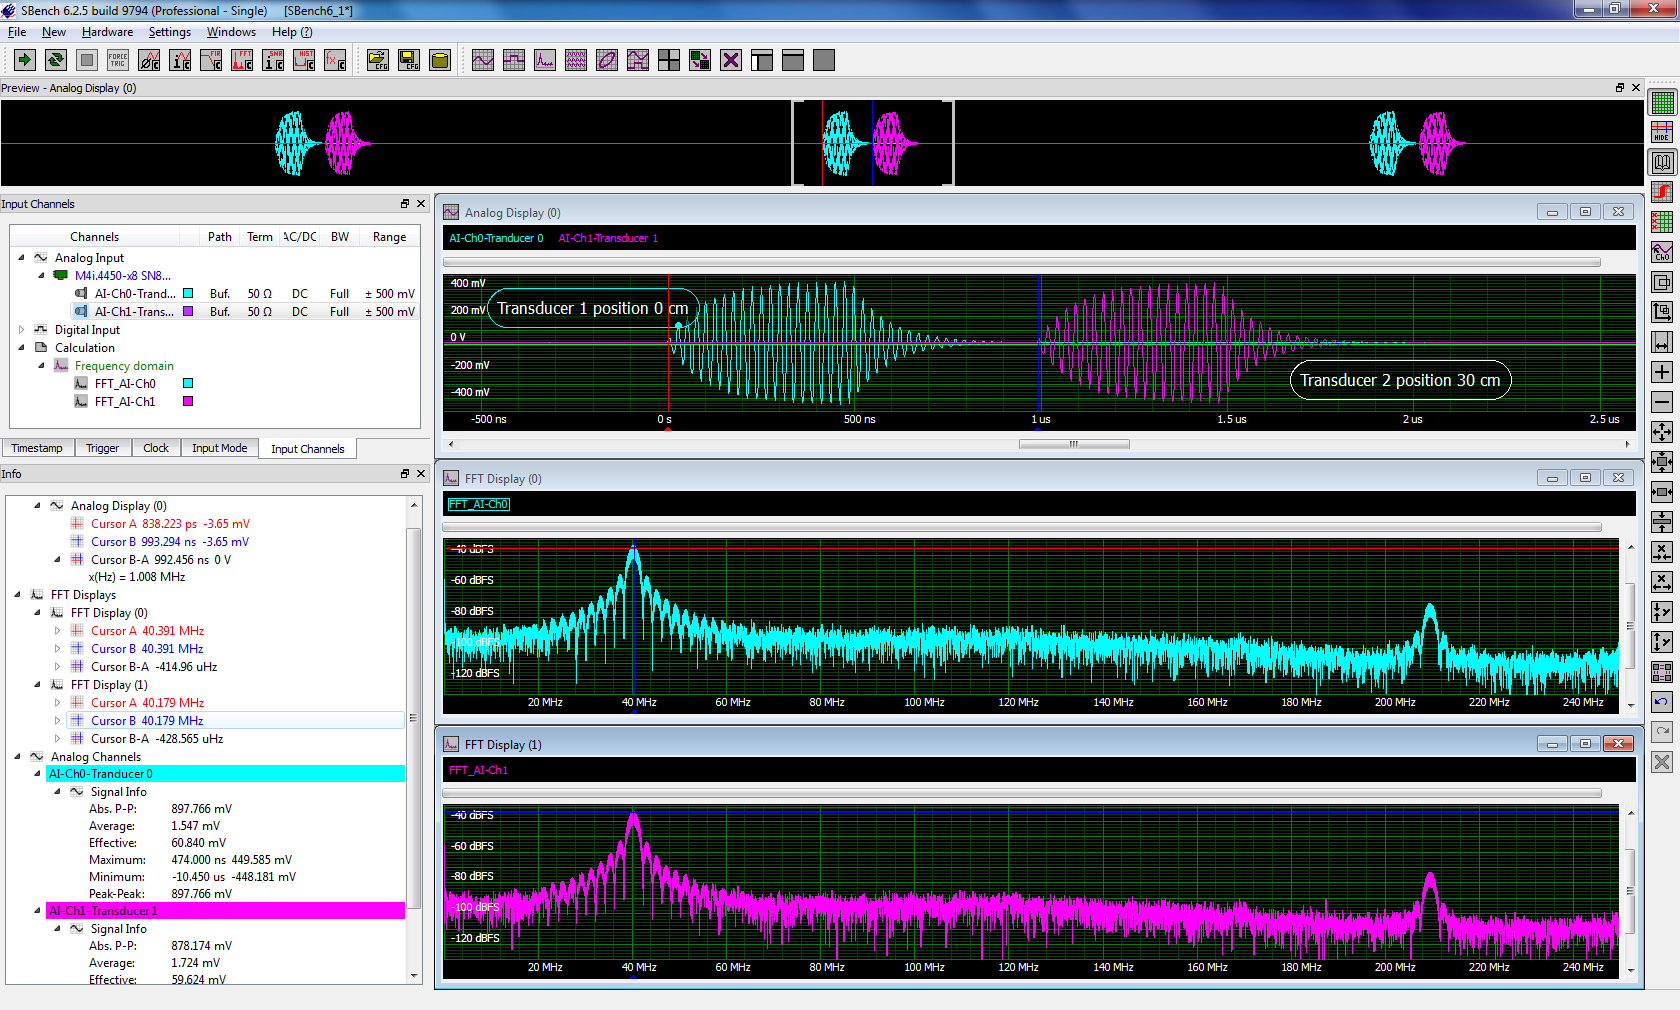
Figure 1 shows the user interface for SBench 6 acquiring waveform from a Spectrum M4i.4450-x8 digitizer.
The user interface uses the standard Windows organization with a title bar on top. Below that are drop down menu headings. These operate just as they do in all Windows applications. Below the drop down menus is the main tool bar containing general hardware and setup icons for controlling the acquisition and basic display setup.
The row of icons down the right hand side form the display toolbar which contains display related buttons that are used to zoom on signals, show the waveform history mode, select different view aspects of the display and control the cursor display modes.
The display grids can be user configured to control their number and orientation. In this image the top most display is the preview pane which shows the entire acquisition. Below that the display windows contain the user selected data. This can be waveforms from any channel or waveform calculations such as the Fast Fourier Transforms (FFT's) shown. Displays can be configured to show multiple grids with single waveforms or multiple waveforms in a single grid. Within each grid the user can zoom the traces horizontally or vertically. Zoomed regions of the selected display are marked by brackets in the preview pane so that the location of the data in the overall acquisition is obvious.
Channel names can be customized to match the measurement application. In Figure 1 channel 0 and channel 1 have been relabeled as Transducer 0 and transducer 2. Channel data can be re-scaled in the input channel setup to read in units appropriate to the measurement. Comments can be added to any trace to help document the displayed results.
There are several tabbed windows on the left side of the display. The uppermost window contains all the key hardware settings as well as a channel list that acts as a source for connecting channels with the display windows. On start-up all the active channels are added to the display window. If channels are activated later they can be moved to a display window by simply dragging and dropping these channels to the desired location.
Input channel settings are affected by double clicking on the channel name or by using the context menu that is activated by the right mouse button to set up a single channel or multiple of channels. Input termination resistance, vertical range, coupling, bandwidth, and input path are easily controlled in this manner.
The Info windows, below the Input window, are used to display measurement results from cursors or parameter measurements. The number of selections displayed can be controlled by using the "settings" mode accessible through a right mouse button click. In the settings mode each measurement and calculation block can be deactivated from the display without deactivating the measurement itself.
Acquisition Setup
In addition to setting up the input channels SBench 6 supports the setup of the acquisition modes, memory allocation, sampling clock, and trigger. These are accessed by tabs marked "Input Mode", "Clock", and "Trigger" in Figure 1.
The Input Mode tab supports selection of either the standard ring buffer (oscilloscope mode) or the first in-first out (FIFO) streaming mode. The standard and FIFO modes each offer three multiple recording methods which provide more efficient use of the acquisition memory, particularly in low duty cycle measurement applications. Low duty cycle applications include those which have short duration events of interest followed by long quiescent intervals. For example, RADAR, ultrasound, LIDAR, Sonar, spectroscopy and stimulus-response type waveforms. The acquisition methods optimized for the capture of these types of signals are Multiple Recording (segment) mode, Gated mode, and ABA (dual time base) acquisition. All of these modes segment the memory and store multiple acquisitions within it. The dual time base ABA mode reduces the sampling rate between triggers saving memory space but providing a view of what is happening in the dead-time between triggers.
The Multiple Recording (segmented) mode allows the recording of multiple trigger events with an extremely short re-arm time. The acquisition memory is divided into several segments of equal size. One segment is filled for each trigger event. The acquisition stops between segments. The user can program pre- and post-trigger intervals within the segment. The number of acquired segments is only limited by the memory used and is unlimited when using FIFO mode. Significant data associated with multiple triggers is stored in the acquisition memory in the contiguous segments. Data associated with the dead-time between events is not recorded. Each trigger event is time stamped so the precise location of each trigger is known.
Gated acquisition uses the state of a gating (enabling) signal, which can be either another channel or an external trigger input, to start and stop the sampling process. Data is only written to memory while the gate is active. As in the Multiple Recording mode, the user can program pre- and post-trigger intervals about the gate. In Gated mode the time stamps mark the opening and closing of the gate not including the pre and post gate acquisition interval. The number of acquired gate segments is limited by the acquisition memory and is only limited by the host memory when using FIFO mode.
ABA mode is a dual time base acquisition combining a fast acquisition on trigger events (B time base) with a slow sampling rate (A time base) between triggers. The ABA mode works like a slow data logger combined with a fast digitizer. The exact position of the trigger events is marked with time stamps as in the Multiple Recording mode.
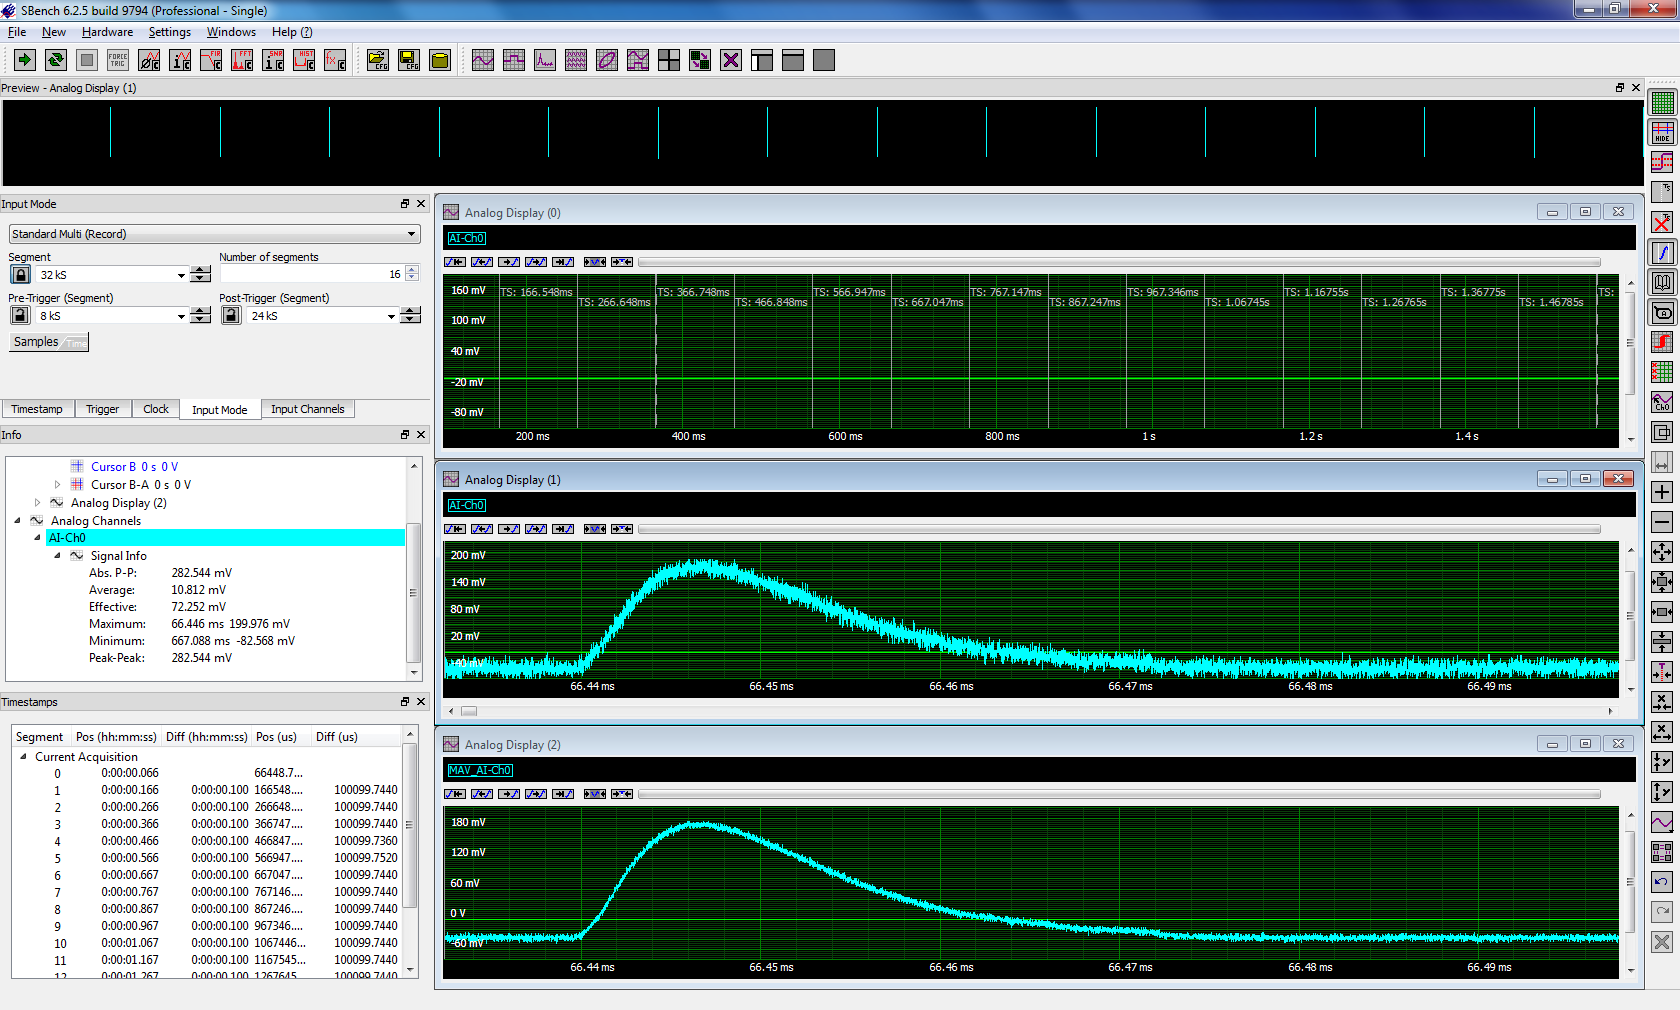 Figure 2 provides an example of how SBench 6 handles a segmented acquisition, in this case a multiple (segment) mode. The source waveform is a simulated laser pulse. The waveform is relatively short but occurs at a 10 Hz rate leaving 100 ms of dead-time between acquisitions.
The preview pane and the upper display grid show all 16 segments. Timestamps, marking the time when each trigger event occurred, are overlaid on that display. The time stamps are also tabulated in the Timestamps window in the lower left hand corer of the SBench 6 screen. The time stamp table includes the segment index, the real time position, the time between adjacent segments, the high precision absolute position of the time stamp and the relative position between segments (also reported in high time precision).
The center display shows a zoom of a single segment. Buttons within this grid allow the desired segment to be selected and displayed.
The bottom grid contains one of the available signal calculations, in this case the average of all 16 segments.
The example shows the concise organization of the SBench 6 user interface integrating control, display, measurement and analysis in one highly interactive program.
Triggering
 Triggering is an essential function for any instrument that acquires and digitizes signals. The wide variation in possible signal waveforms, levels, and timing requires that the digitizers trigger circuit be extremely flexible. The hardware trigger sources include any of the input channels and either of the two external trigger inputs (Ext0 or Ext1). In addition to the hardware trigger sources there is also a software trigger which allows triggering under program control. Trigger sources can be used individually or combined using a multi-source trigger using AND/OR logic elements. Each of these sources is capable of supporting multiple trigger types.
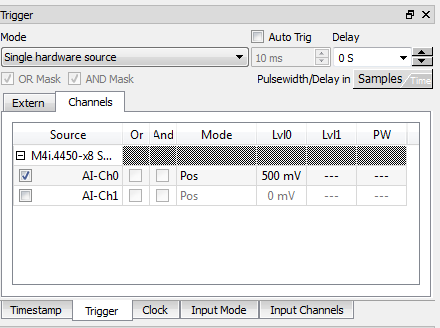
The Trigger tab in SBench 6, shown in Figure 3, is used to select the appropriate trigger setup.
Triggers can be simple edge triggers, selecting a source, trigger slope, pulse width (in selected digitizer models) and trigger level as shown in Figure 3. Other trigger channel modes include window and rearm (hysteresis). Trigger gates can be generated from any hardware source using High, Low, In Window, or Out of Window modes. Gates are usually used for logical operations utilizing multiple sources.
As in the case with the input setup double clicking on an input channel will bring up a pop up window to set the related trigger parameters. Double clicking on one of the trigger parameter fields will produce scroll boxes with related settings.
The Trigger window in SBench 6 provides complete control of all trigger related functions.
Display
SBench 6 is a powerful display formatter allowing multiple display source, types and layouts. Figure 4 gives an example of this power.
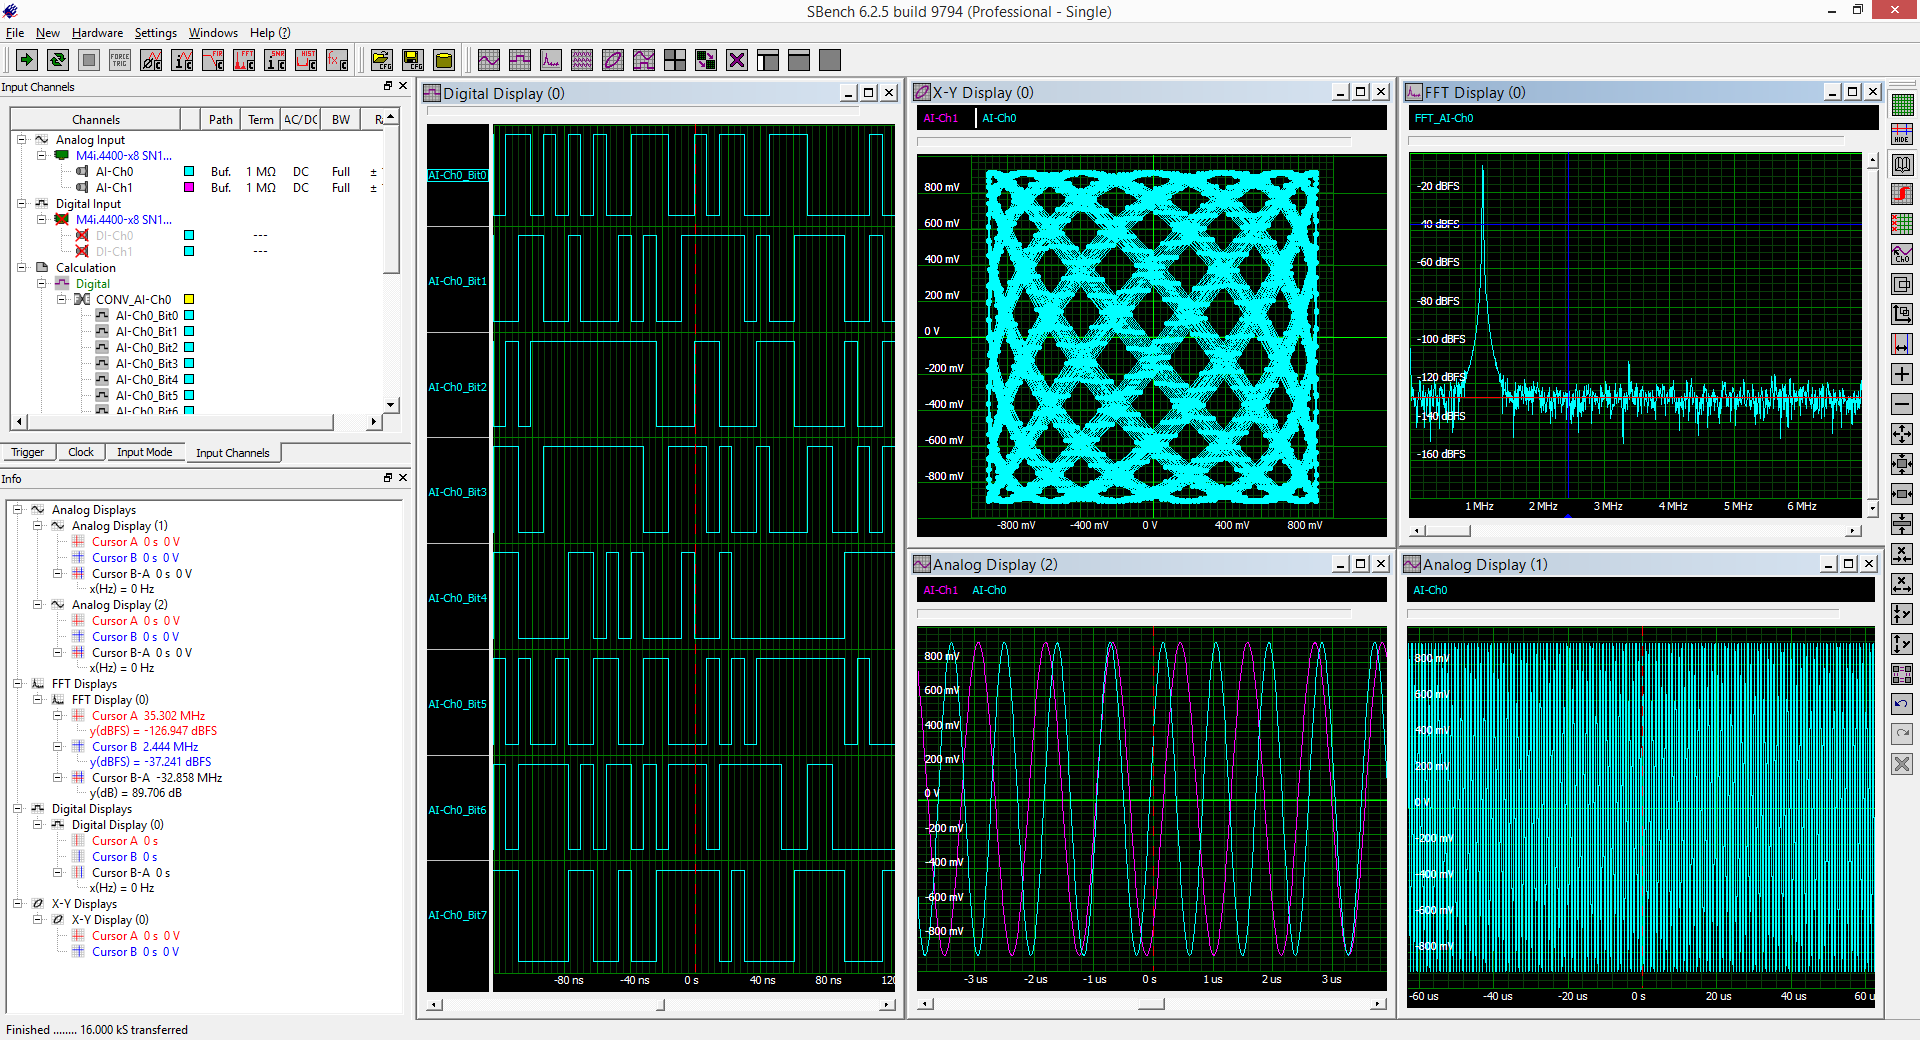 The displays shown in the figure include a single grid (left) showing eight digital waveforms, an analog display with two signals (Lower center), an X-Y display (upper center), an FFT (upper right), and a single channel trace (lower right). The main toolbar on the top of the display is used to add any of these display grids. The display toolbar to the right of the display contains icons that can be used to control each display. Displays can be zoomed both horizontally and vertically. A single button press can fit the waveform to the screen automatically, while another zooms to the cursor area. There are controls to synchronize the displays by aligning cursors or the trigger location. Additionally, various elements of the display such as the cursors, grids, trigger indicators and comments can be turned on and off.
Right clicking within any of the display grids will open a pop-up allowing all the displays to be tiled horizontally, vertically or symmetrically as well as cascaded. Display characteristics such as the choice of colors, line widths and selective dimming of background displays can be selected and set. Right clicking on the horizontal or vertical axes brings up a pop up box that allows you to enter custom limits to set the visible area of the display.
As you can see the SBench 6 program offers a host of display tools allowing customization of the displays to obtain the most effective view of the data.
Measurements
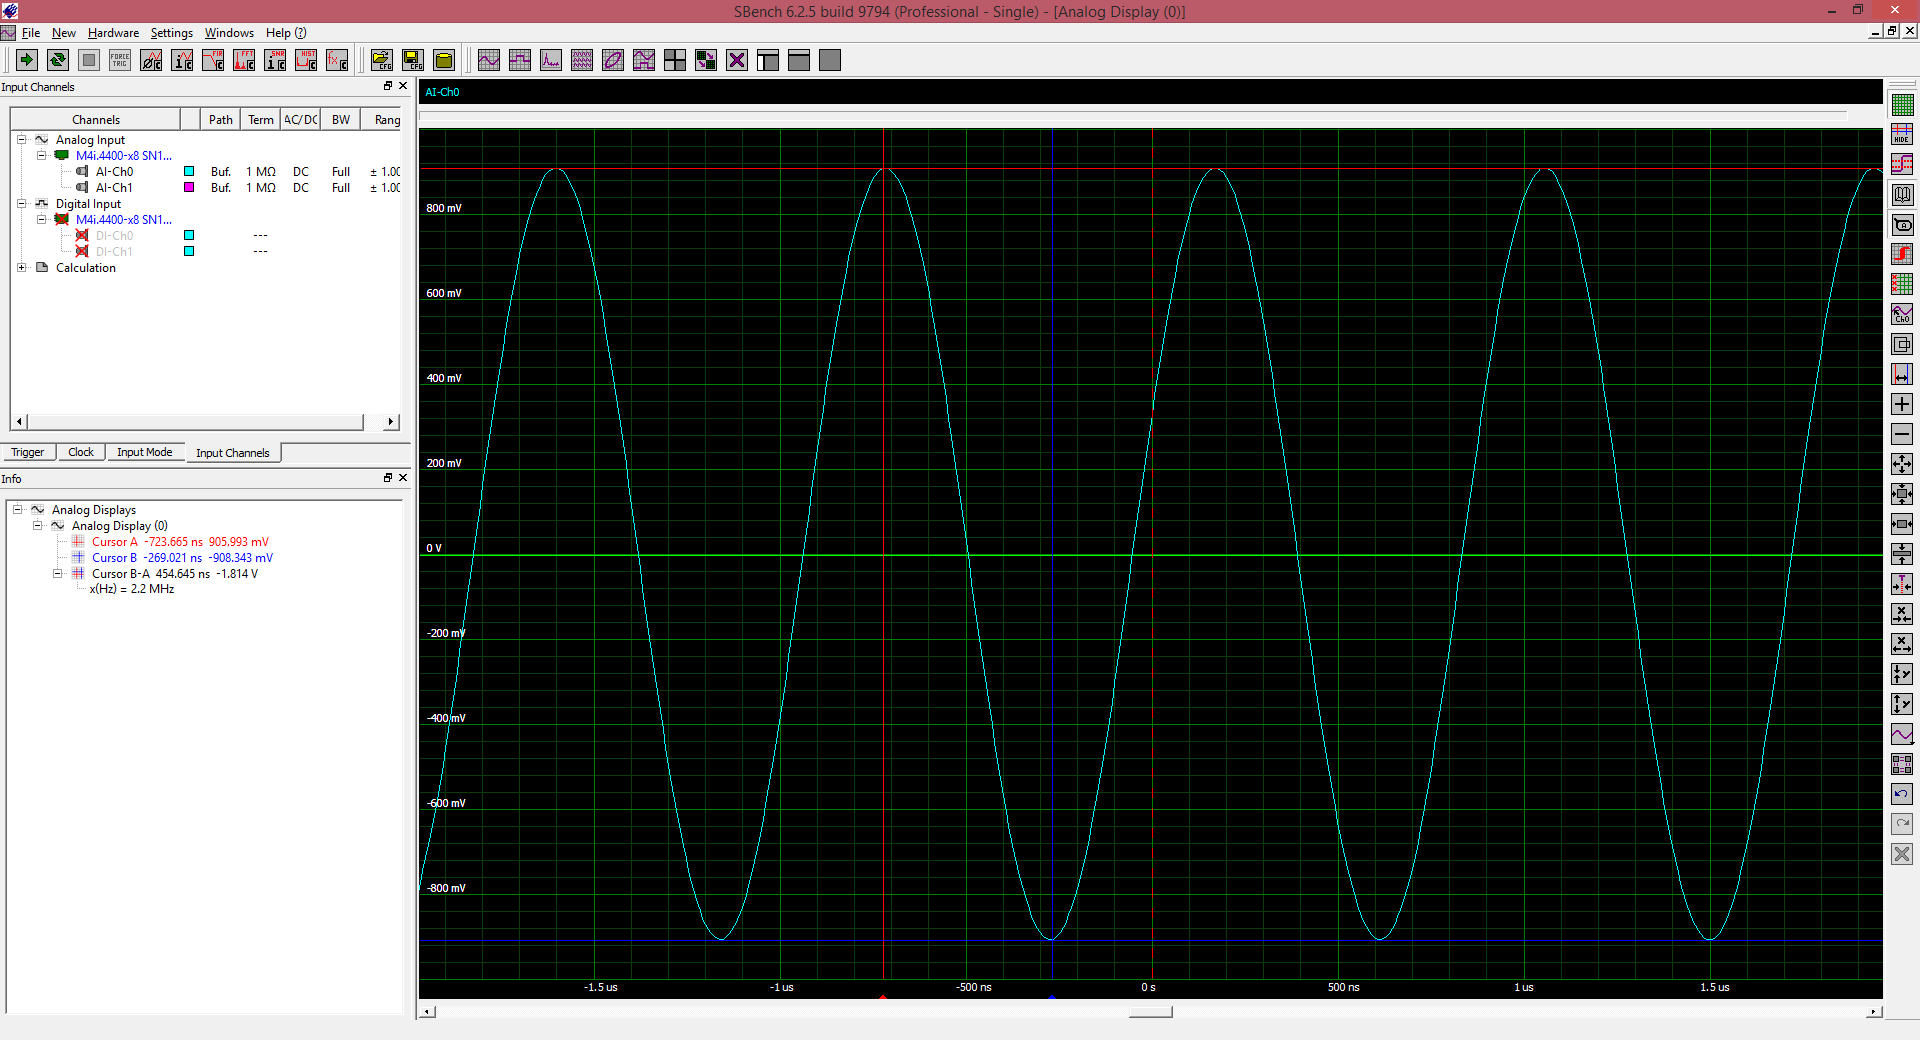 There are two measurement tools available in SBench 6, cursors and parameter measurements. There are two cursors available in each display grid. The first is set by left clicking the mouse within a display grid and dragging. A red cursor will appear, drag it to the desired point on the trace so that the horizontal and vertical cursor lines intersect at the desired measurement point. Set the other cursor by right clicking in the display grid and dragging the mouse to set the blue cursor to the desired location. The cursor readouts appear in the Info window on the left side of the screen as shown in Figure 5.
The horizontal and vertical readouts of each cursor location are listed in text with the corresponding color. In addition, the amplitude and time difference are computed and displayed along with the reciprocal of the time difference. Cursors can be turned off by pressing the hide cursor icon in the display toolbar on the right hand side of the display.
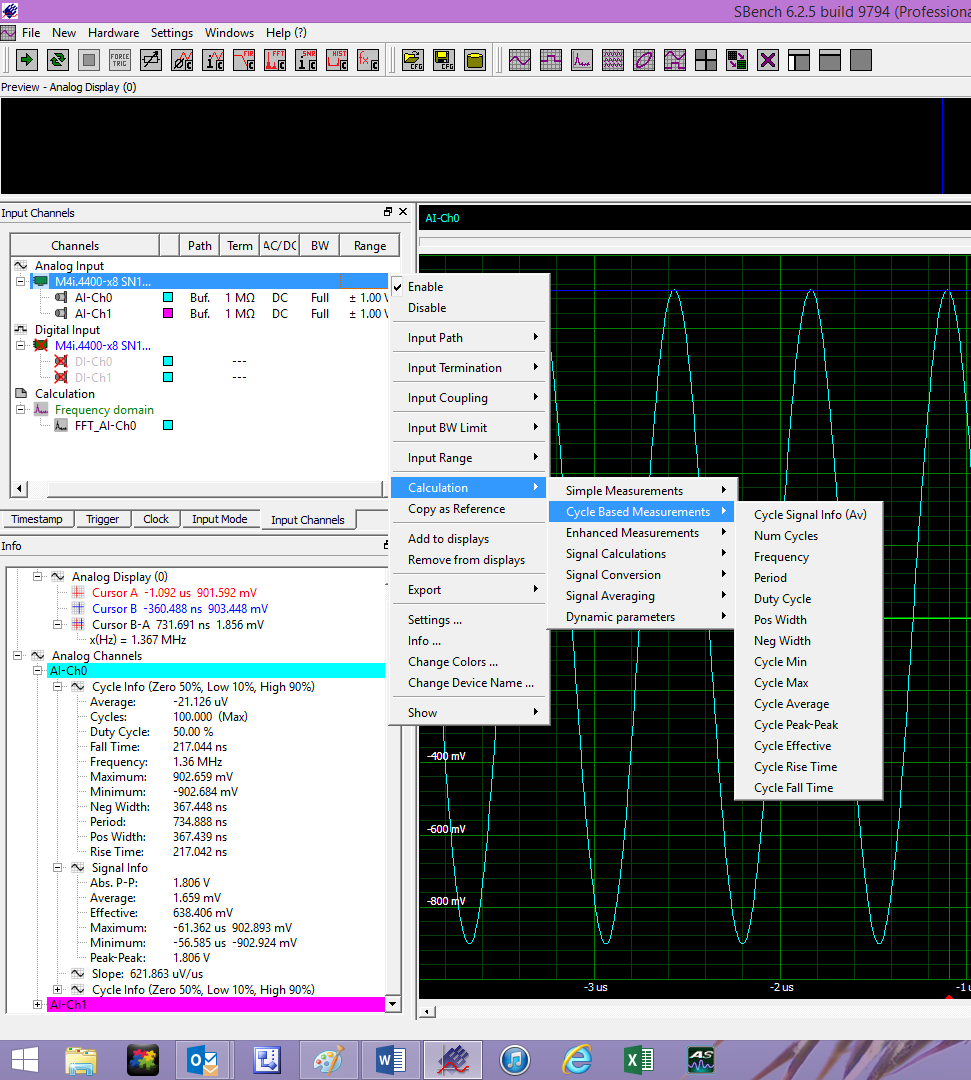 Parameter measurements for any waveform are accessed by right clicking with a mouse on any channel shown in the Input Channels window. This will bring up a series of pop-up boxes as shown in Figure 6.
If the "Calculation" item is chosen then another pop-up will offer a selection of measurements and calculations. Selecting any of the measurements will give you a choice of both amplitude, time, frequency, and cyclic measurements. The detailed list of measurements is shown in table 1. Each measurement selection also includes a "Signal Info" selection which is a summary of all the available selections in the group. The measurement parameter readout also appears in the Info Window as shown in Figure 6.
Parameter measurements are, in general, far more accurate than measurements derived from cursors. Cursor measurements being much more dependent on operator skill in placing the cursors.
Analysis
SBench 6 offers a host of analysis tools that can be applied to the acquired data. The list of analysis functions includes waveform arithmetic (called waveform functions), Fast Fourier Transform (FFT), histogram, finite impulse response (FIR) filter, averaging, analog signal concatenation, and signal conversion (from analog to digital and digital to analog).
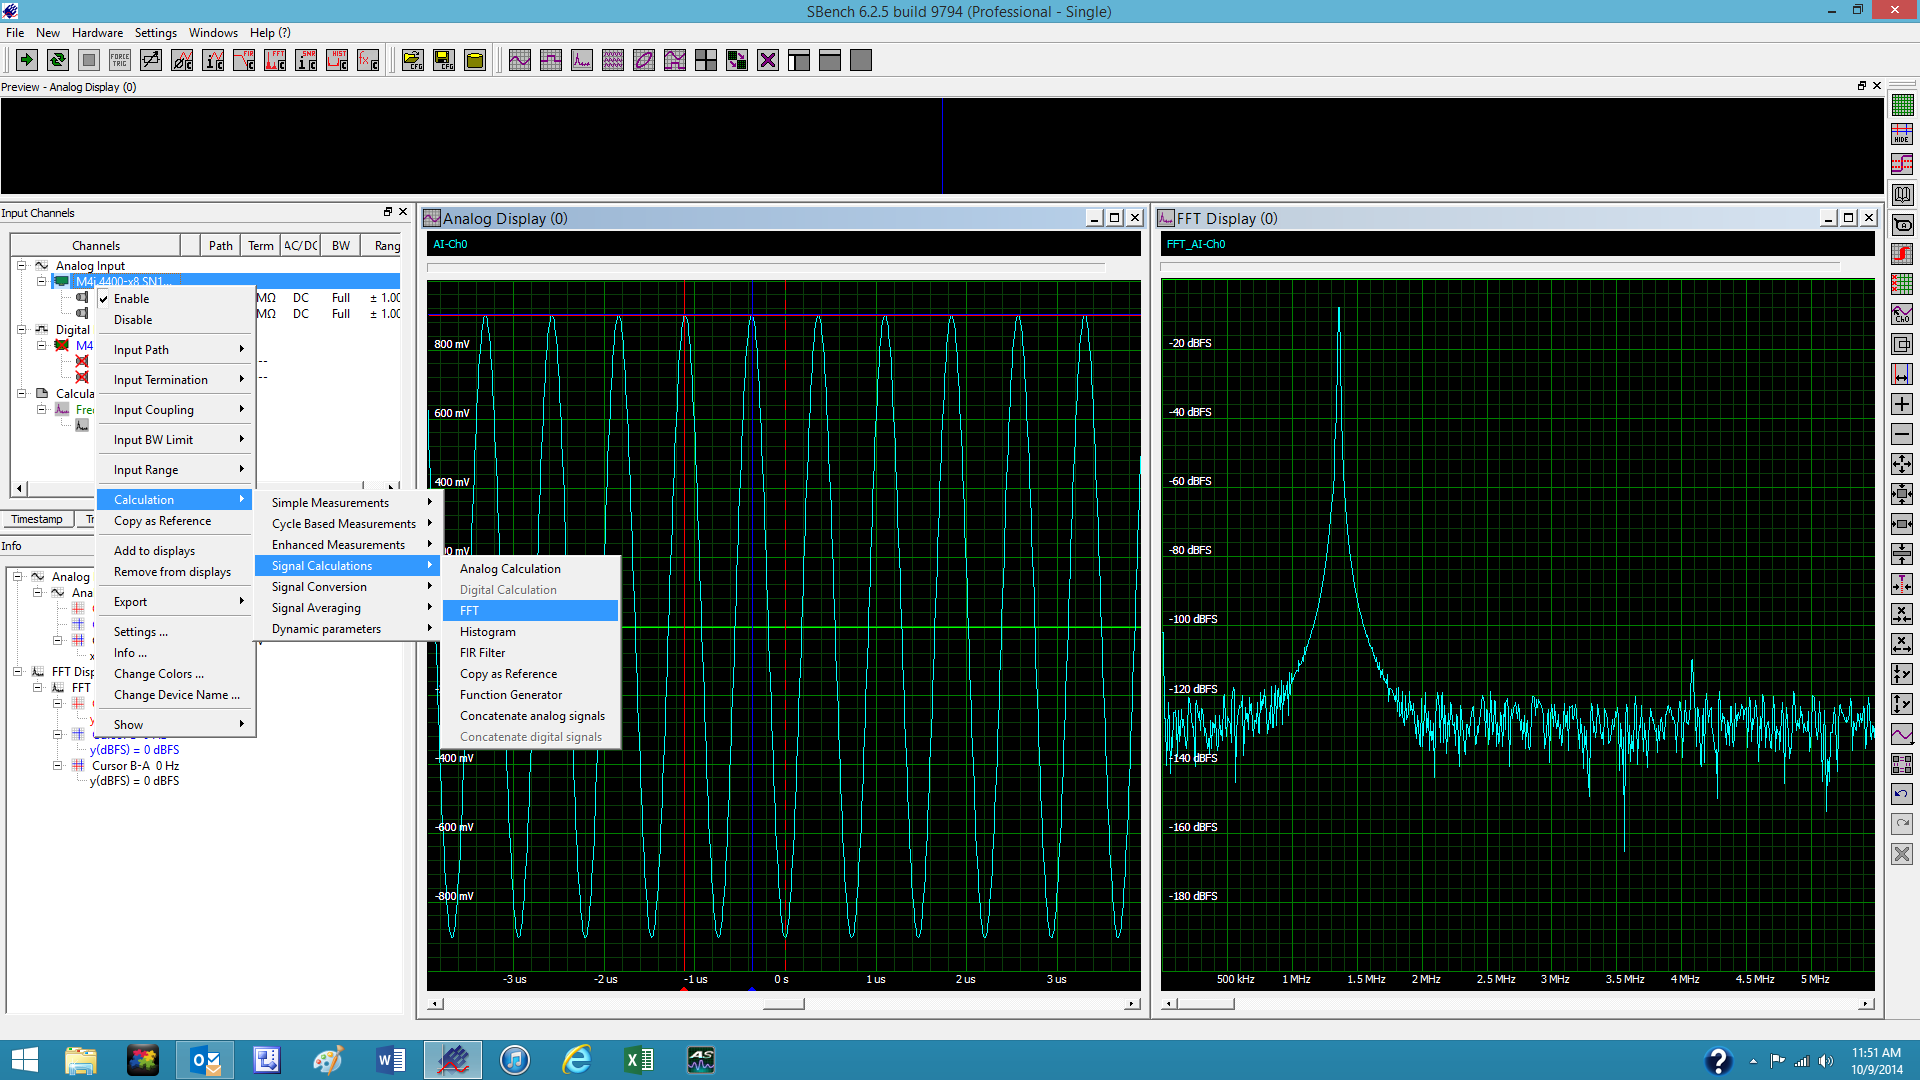 Analysis functions are accessed, as were the measurements, by right clicking on an input channel in the Input Channels window as shown in Figure 7.
Each of the signal analysis functions will have its own unique setup selections to be chosen by the user based on need. Many analysis calculations can be chained; thus, an FFT may be averaged.
Analysis offers powerful tools for interpreting data and can be applied immediately as data is acquired or can be applied to data which has previously been stored and recalled into SBench 6.
Record and Archive
SBench 6 supports archival functions that allow the storage and recall of data. These functions include saving and recalling setups, waveform data in a variety of formats, and screen images stored as files or printed as a hard copy. The file drop down menu offers the necessary selections to accomplish these tasks.
Data can be stored using the Export function. Data can be exported in formats compatible with SBench 6 or SBench 5, ASCII files, MATLAB files, .WAV files, Binary files or VCD (Value Change Dump) file images.
Data files in SBench 5 or 6, ASCII, Wave, or binary formats can be imported back into SBench 6. This provides the mechanism for doing offline analysis of previously acquired data. Archived data files can imported for additional measurement and analysis or to compare with current acquisitions.
Hardcopy images, in color or black and white, of any selected waveform display can be saved as a graphics file or sent to a printer. This provides graphical data for reports or presentations.
Conclusion
SBench 6 is a highly interactive software package that provides immediate access and control of any of Spectrum's digitizers or digital NETBOX products. It supports acquisition, display, measurement, analysis, archiving and review of acquired data.