Introduction
Line power measurements are commonly required to evaluate the performance of devices or circuits. Modular digitizers can make these power measurements. Digitizers are voltage responding measurement instruments. They can also measure current using suitable current probes or current shunts. Acquiring current and voltage next leads to calculating power based on the product of the acquired current and voltage waveforms. Power is the rate of transferring energy in a circuit and it is described by a number of attributes such as real, apparent, reactive, and instantaneous power. This application note will address making basic power measurements in AC circuits and devices using a modular digitizer.
Basic Power Measurements
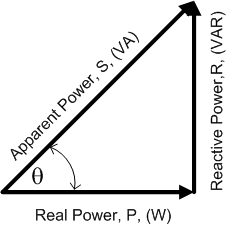 Instantaneous power is calculated as the product of applied voltage and current. Real power (P) is the average or mean value of the instantaneous power measured in Watts. Circuits containing reactive elements (inductors or capacitors) can store energy and reverse power flow so that power flows from the load back to source. This is reactive power (R), measured in units of Volt-Amps Reactive or VAR. The vector sum of the real and reactive power is called total or apparent power this is illustrated in Figure 1.
Apparent power (S) can be computed as the product of the effective or rms voltage and effective or rms current. The units of apparent power are Volt-Amps (VA). The angle (a) enclosed by the real and apparent power vectors represents the phase difference between the current and voltage waveforms. The cosine of that angle, the ratio of real power and the apparent power is called the Power Factor (pf).
pf=cos(a)=P/S
If the device is purely resistive the current and voltage waveforms are in phase, the apparent and real power are equal and the power factor equals one. As the reactive component increases the power factor decreases.
Measuring Line Voltage
Voltage measurements require the use of probes. Conventional oscilloscope, high impedance probes can be used with a digitizer. The ability to be able to scale vertical voltage data to account for the probes is very useful. Since most power measurements require line (mains) voltage measurements it is best to make these measurements differentially in order to avoid grounding issues associated with single ended probes. The digitizer should be able to accept two probe inputs and compute the difference. Alternatively, the voltage on the hot and neutral lines can be acquired separately and subtracted using waveform calculations. If a differential probe is available that can also be used.
Measuring Line Current
The most convenient method of making current measurements is to use an appropriate current probe. Make sure that any current probe you use has controls separate from the measuring instrument. The output of the current probe can be applied to a digitizer channel with appropriate scaling to display signals from the probe in units of current.
Digitizer Selection
Most line frequency measurements are made with fundamental frequencies of 50 to 400 Hz so the bandwidth requirements of a digitizer are not very great. If there is an interest in doing conducted emission testing then the ability to accommodate up to the 40th harmonic of the power fundamental without significant loss is useful. This would place the bandwidth requirement at about 20 kHz or greater.
The digitizer should have sufficient amplitude resolution to render the higher order harmonics of the power line, 12 to 16 bits will suffice.
The number of channels depends on whether single end or differential measurements are intended. Differential measurements combine two channels for each measurement. For a single phase, line measurement four input channels will yield two differential channels. For three phase measurements on each phase, six or greater channels are required. Assuming three differential voltage channels and three single ended current channels then nine channels are required. Since most digitizers offer one through sixteen channels in a binary progression (1/2/4/8/16) you should select the next higher number of channels to accomplish the measurement task.
The sample rate, like bandwidth should be greater than four or five times the required bandwidth.
Table 1 provides some guidance for selecting Spectrum digitizers or digitizerNETBOX models
| Model Family | Interface | Channels | Channel Input | Bandwidth | Maximum Sampling Rate |
|---|---|---|---|---|---|
| M2i.59xx | PCIe | 1, 2, 4, 8 | Single-ended Differential |
2. 10, 20, 40, 60 MHz | 5, 20, 40, 80, 125 MS/s, |
| DN2.59x | LXI, LAN | 4, 8, 16 | Single-Ended Differential |
2. 10, 20, 40, 60 MHz | 5, 20, 40, 80, 125 MS/s, |
| DN6.59x | LXI, LAN | 24, 32, 40, 48 | Single-Ended Differential |
2. 10, 20, 40, 60 MHz | 5, 20, 40, 80, 125 MS/s, |
Single Phase Power Measurement Example
The following example measures the power required by a small, line powered cooling fan. The measurement were made using a digitizerNETBOX model DN2.496.04 with 4 analog channels, 16 bit resolution, 60 MS/s sample rate, and a 30 MHz bandwidth. A Tektronix model P6042 current probe and a pair of passive oscilloscope probes were used to acquire the current and voltage waveforms. The line current and line voltage were measured. Line voltage was measured differentially so that neither the hot or neutral lead of the power line was grounded.
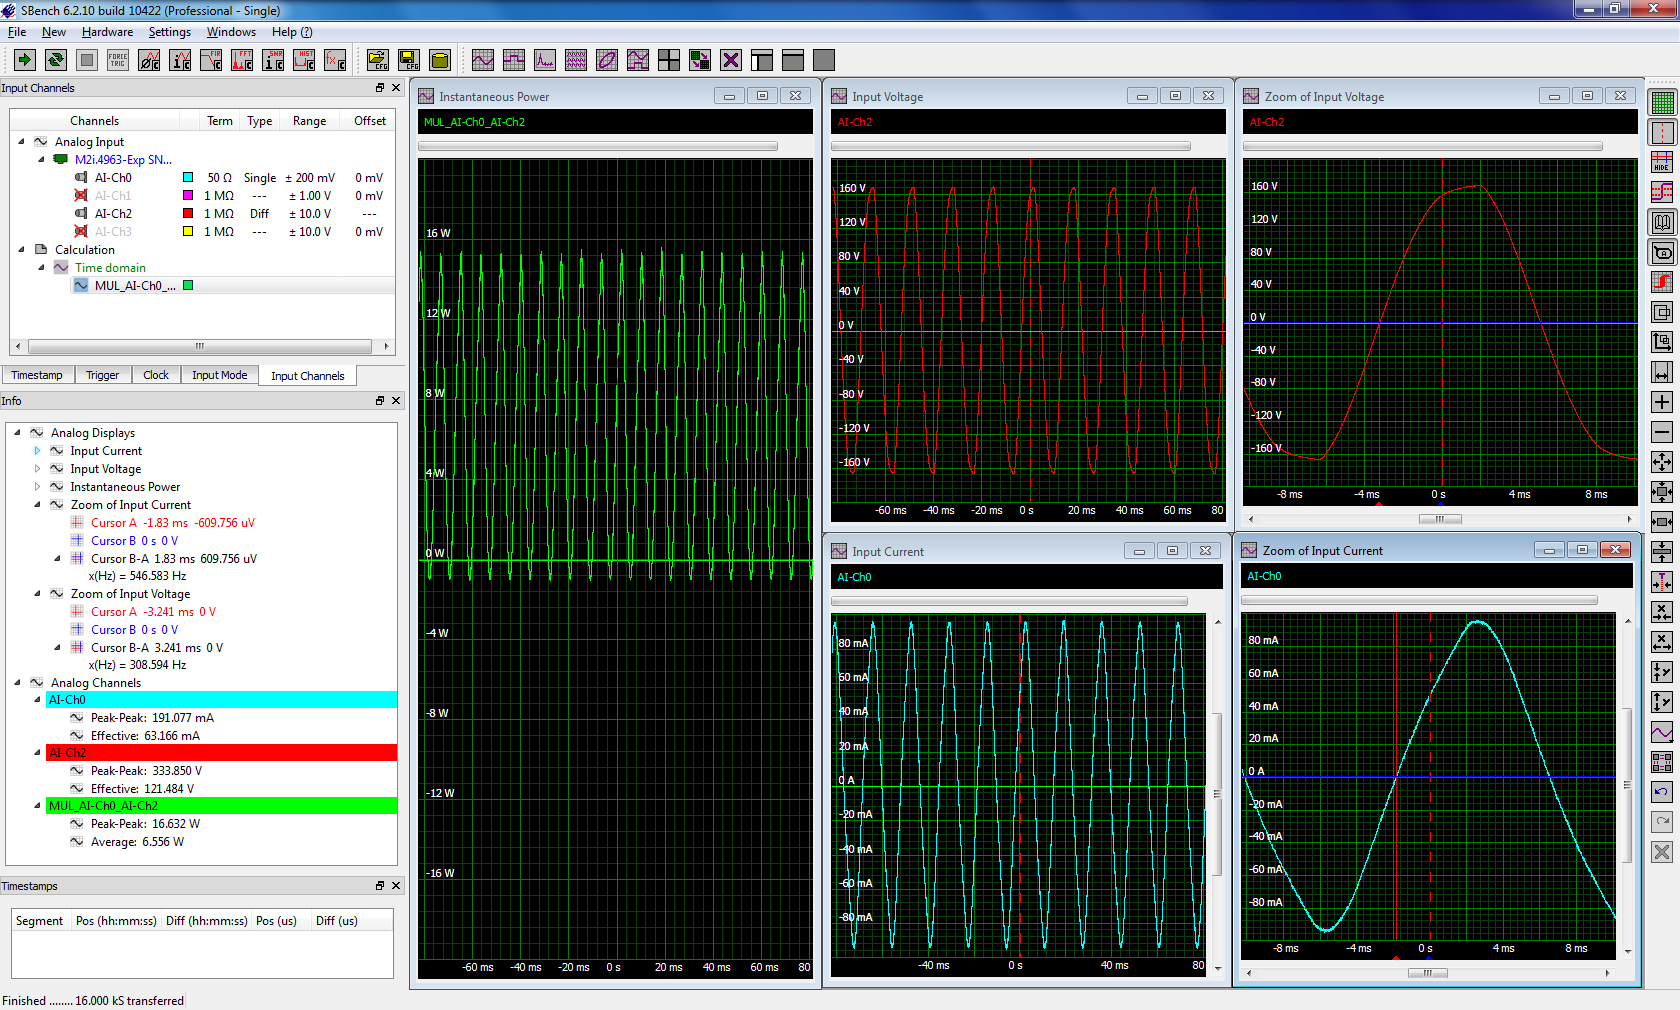 Figure 2 shows the resulting measurement from Spectrum's SBench 6 software which is used to control and process the acquired data.
The input voltage is measured differentially with the two passive probes connected to channels Ch2 and Ch3. The channels are combined and show as channel Ch2 in the top center grid. The readout is scaled to reflect the attenuation of the probes. The current, reflecting the output of the current probe, appears on channel Ch0 in the lower, center grid. This data is also scaled by the sensitivity of the current probe so it reads in vertical units of Amperes. The peak to peak and effective (rms) values of both current and voltage appear in the Info pan on the left of the figure.
Instantaneous power is computed by using SBench 6's analog calculation to multiple the current and voltage waveforms. The power is displayed in the leftmost grid. The peak to peak and average values of the power also are listed in the Info pane. The average of the instantaneous power represents the real power and is recorded as 6.6 Watts.
Apparent power is computed by taking the product of the effective values of the line current and voltage. Based on the measured values (121.5 V and 63.2 mA) the apparent power is 7.68 VA.
This allows us to compute the power factor as 0.86. Observing the horizontally expanded view of the current and voltage waveform in the rightmost two grids we can see that the voltage waveform (top-right) leads the current waveform indicating an inductive characteristic. Cursors marking the positive slope zero crossing record that the voltage waveform is 1.44 ms in advance of the current waveform. This represents a phase advance of 31 degrees. This can also be calculated as the cos-1(pf) or 30.68 degrees. The calculation based on the power factor is more accurate because it does not suffer from cursor placement uncertainties.
Line Harmonics
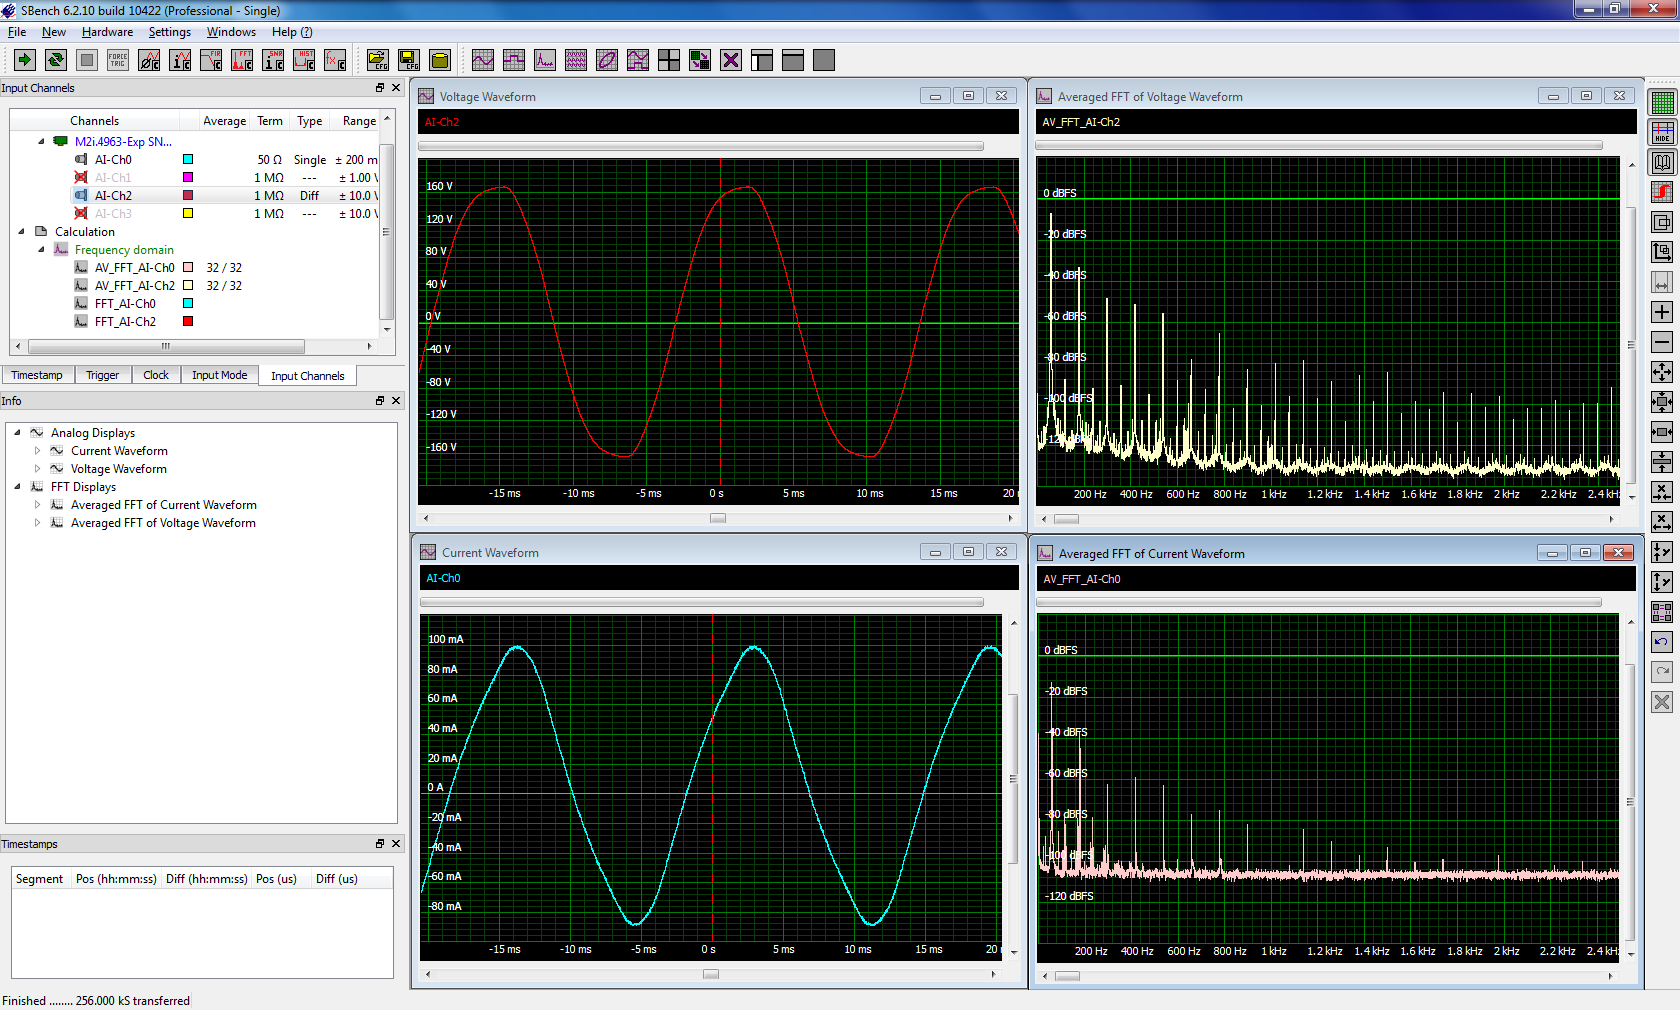 Having acquired the current and voltage waveforms we can expand the analysis to the frequency domain by Figure 3 shows the average spectra of both the line current (lower left) and line voltage (upper left) waveforms:
The line voltage spectrum has more, higher order harmonics. The odd order harmonics are the most prominent. The current spectrum has a lower overall harmonic content, but it too is predominantly odd harmonics.
Three Phase Power
Three-phase electric power is a type of poly-phase AC electrical distribution system of electric power generation, transmission, and distribution. It is used to power large motors and other heavy electrical loads. A three-phase system is usually more economical than an equivalent single-phase or two-phase system at the similar voltage levels because it uses less conductor material to transmit electrical power. A single phase AC power source requires two conductors, a three phase source can transmit three times the power by using only one extra conductor. This means that a 50% increase in transmission cost yields a 200% increase in transmitted power.
Three-Phase Connection Terminology
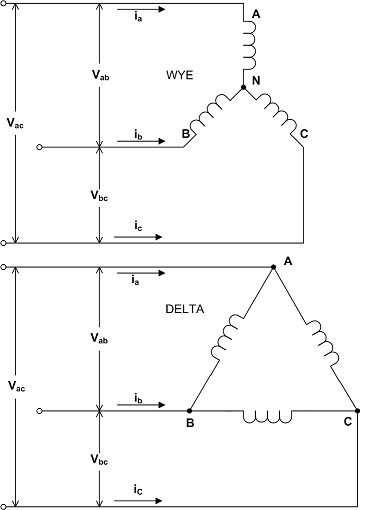 Three-phase connections, such as the three-phase motors shown in Figure 4, are connected in either WYE (upper schematic) or DELTA (lower schematic) configurations.
The Voltages Van, Vbn, and Vcn in the WYE connection are called phase voltages. Voltages marked Vab, Vbc, and Vac are line voltages. The currents Ia, Ib, and Ic are phase currents. The total power dissipated by the load is the sum of the individual phase current-voltage products in the WYE connection. Note the bold text indicates vector operations:
Pt = Ia*Van + Ib* Vbn + Ic*Vcn
Generally, power is calculated using the line voltages rather than the phase voltages.
Figure 5 shows a phasor diagram of the phase voltage, phase current, and line voltages. Voltage calculations are performed vectorially.
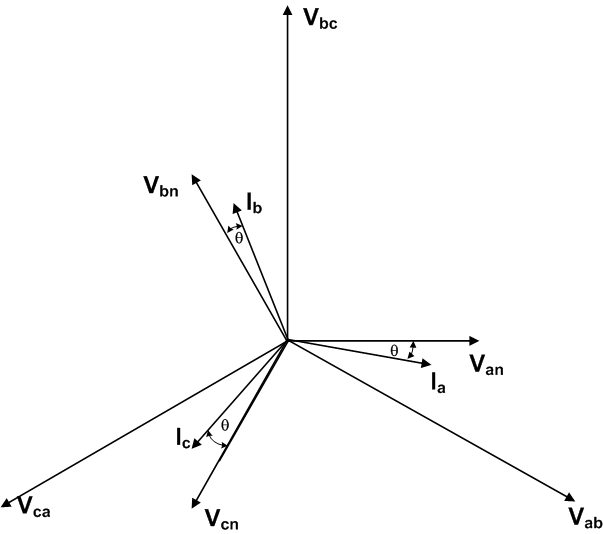 The magnitudes of the line voltages in a balanced system are equal to SQRT(3) times the phase voltage. Note that the phase voltages precede the line voltages by 30 degrees. This is a result of the vector subtraction used to compute the line voltages from the phase voltages.
High voltage differential probes are used to measure the line and phase voltages, they apply a 100:1 attenuation to the signal. The resulting phase voltages at the digitizer input are 1.69 V peak (3.38 Vpk-pk). These voltages are scaled by a factor of 100 due to the use of a ÷100 probe. This will result in phase voltages reported as 169 Vpk (338 Vpk-pk). This is 120 Vrms. The line voltages are 3 times the phase voltage, or 208 Vrms. This is the nominal three-phase voltage in the United States.
We can verify the above by acquiring the phase voltages on the digitizer and then computing the line voltages. This is shown in Figure 6:
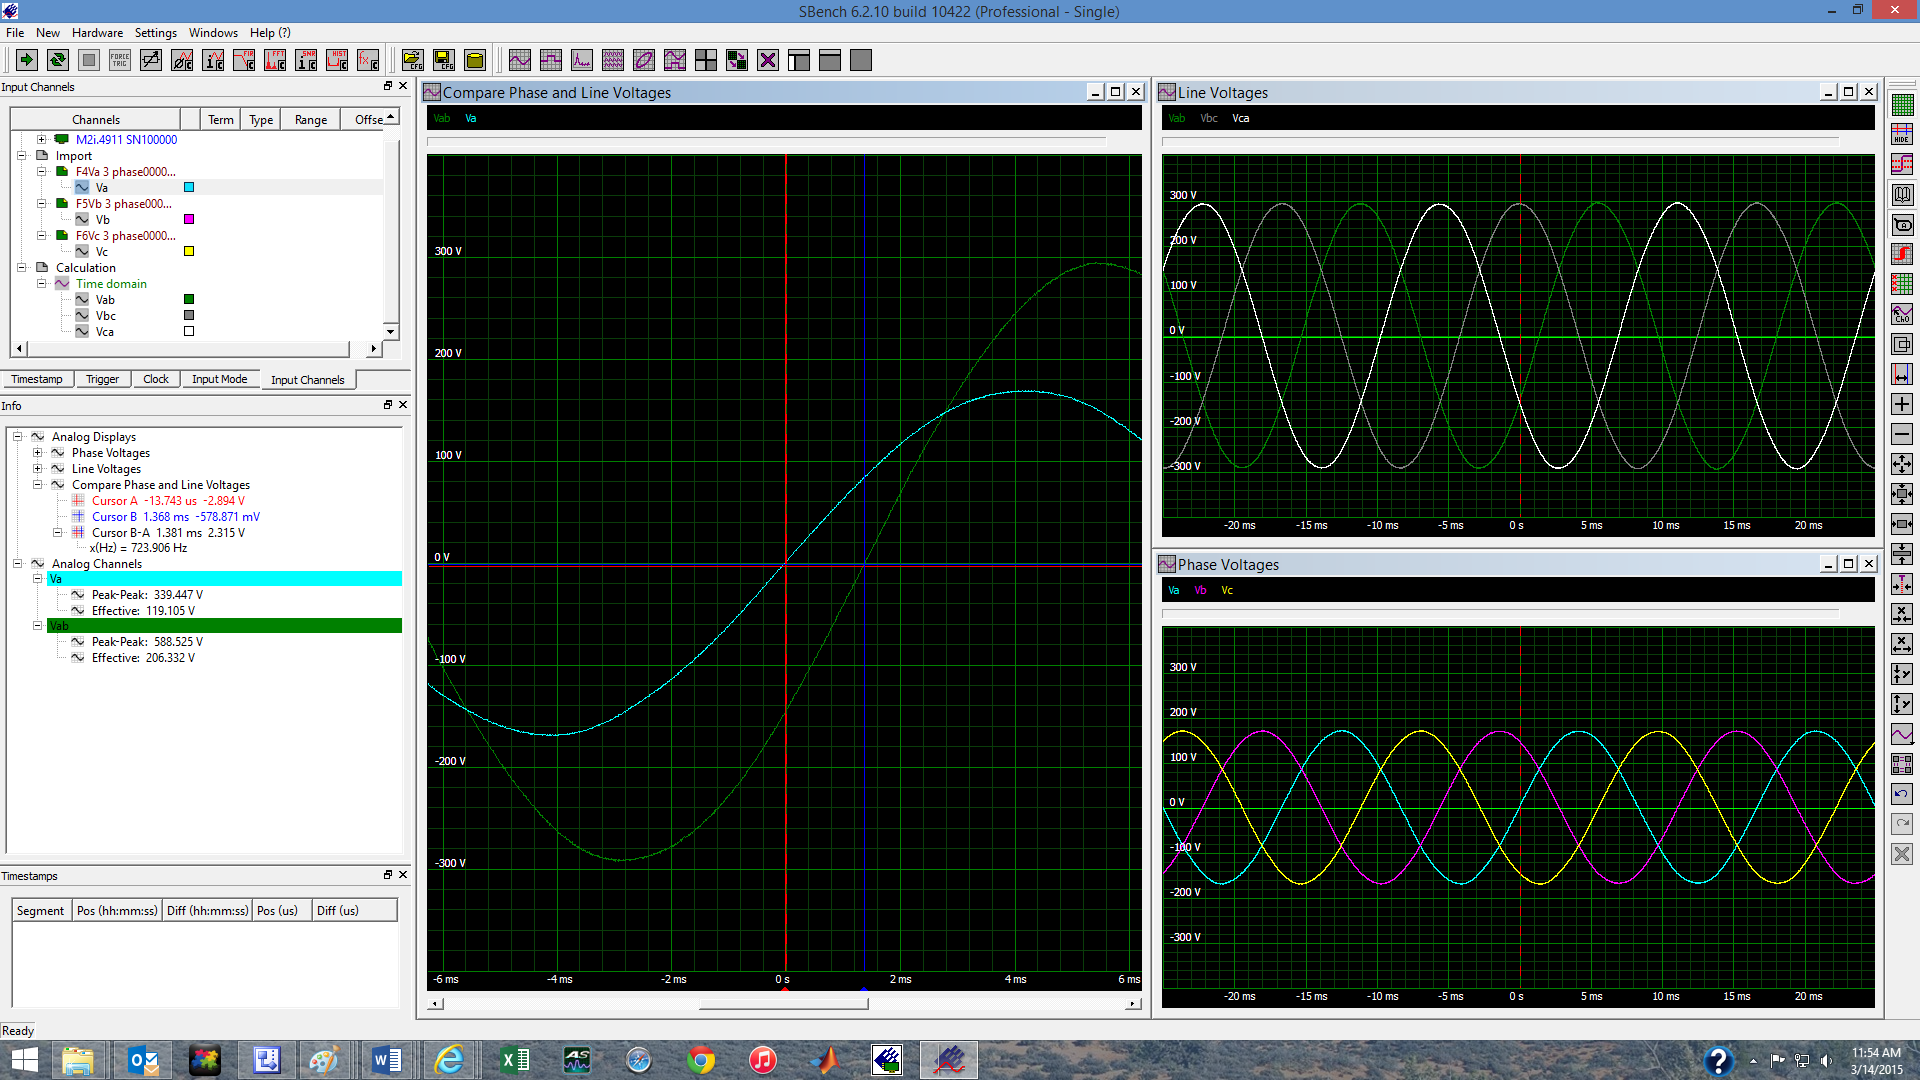 Channels Va, Vb, and Vc are the measured phase voltages. Vab, Vbc, and Vca are the computed line voltages (nominally 586 Vpk-pk). The phase difference between the phase voltage and its adjacent line voltage is 30 degrees as confirmed by the cursor measurement in the zoom trace in the leftmost grid. The line voltage, Vab lags the phase voltage, Va, by 1.38 ms out of a period of 16.67 ms. Phase differences between the line voltages are 120 degrees.
The current phasors in Figure 5 are shown with a general phase difference, [a], from the phase voltages. This angle, [a], represents reactive components that can possibly be incorporated in the motor windings. Our experiment uses a pure resistive load resulting in being equal to 0 degrees.
Three Phase Power Measurements
In Figure 7, we show the phase voltages (Va, Vb, and Vc), phase currents (Ia, Ib, and Ic), and phase power dissipation (Pa, Pb, and Pc) for a WYE-connected load (where we have access to both the phase and line voltages). Multiply the phase voltage by its related phase current and the result is the instantaneous power in each phase. The mean value of the instantaneous power is the real power component. The sum of all three phase-power readings is the total real power of the load.
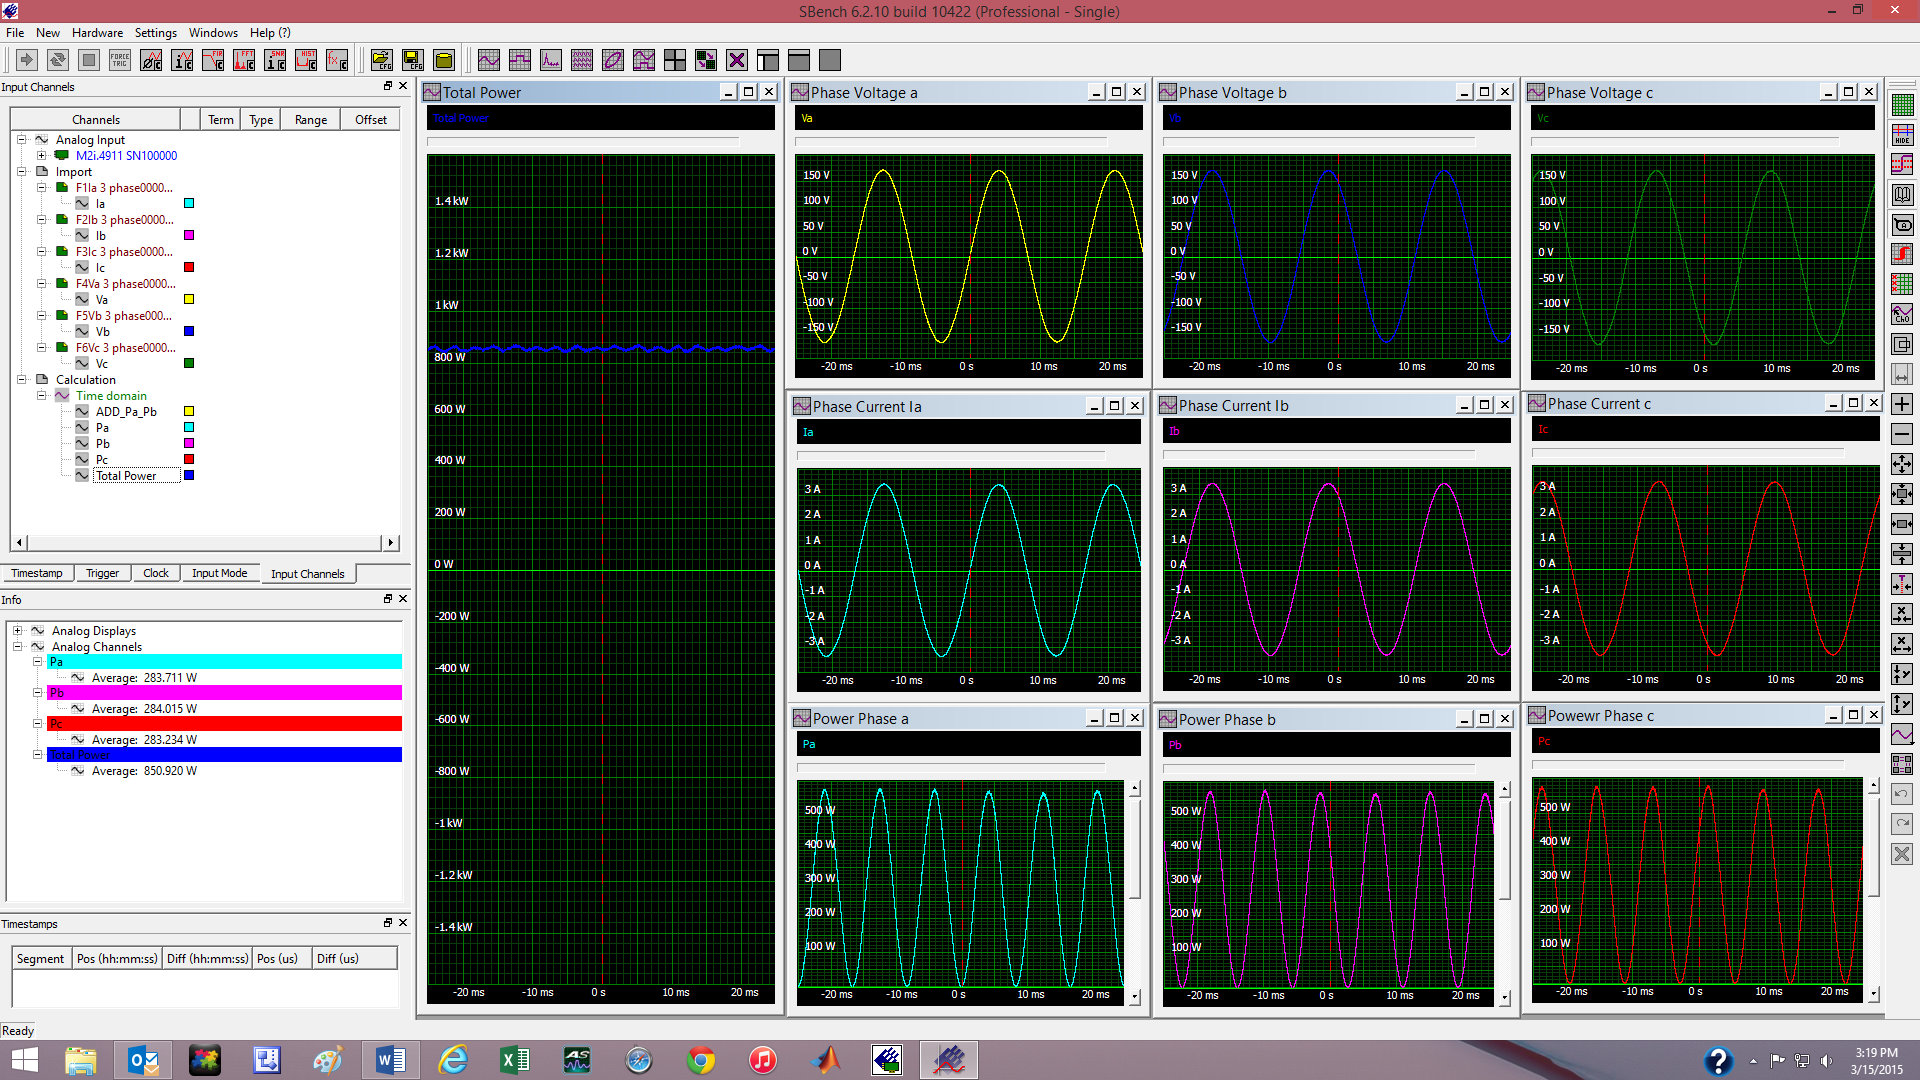 This measurement is referred to as the three-wattmeter power measurement. In order to make this measurement using external differential probes to measure the voltages, it will require six channels. If single ended probes are used then the number of channels increases to nine. The flexibility of being able to specify up to 16 channels in the digitizer configuration is a major advantage in this type of measurement.
The phase voltages are shown in the top row of Figure 7. Phase currents appear in the center row. The phase power appears in the bottom row. The sum of all three phase power waveforms appears in the leftmost grid labeled "Total Power" Note that the total power is relatively constant. Parameters, shown in the Info pane on the left read the average values of the individual phase power waveforms along with the total power. The sum of the average values of the three phase-power measurements equals the average total power. The measured result for the total power is 850.9 Watts
The Two Wattmeter Method
An alternative technique is the two-wattmeter method, which requires measurement of only two line voltages and two phase currents. In mathematical form:
PT (t) = Vac(t) ia(t) + Vbc(t) ib(t)
This can be derived as follows:
This can be verified using the following mathematical derivation:
PT = Va(t) ia(t) + Vb(t) ib(t) + Vc(t) ic(t)
but, using Kirchhoff's current law:
ia + ib + ic = 0 or +ic = - ia - ib
PT(t) = Va(t) ia(t) - Vc(t) ia(t) - Vc(t) ib(t)+ Vb(t) ib(t)
PT (t) = Vac(t) ia(t) + Vbc(t) ib(t)
Where: Va - Vc == Vac and Vb - Vc == Vbc
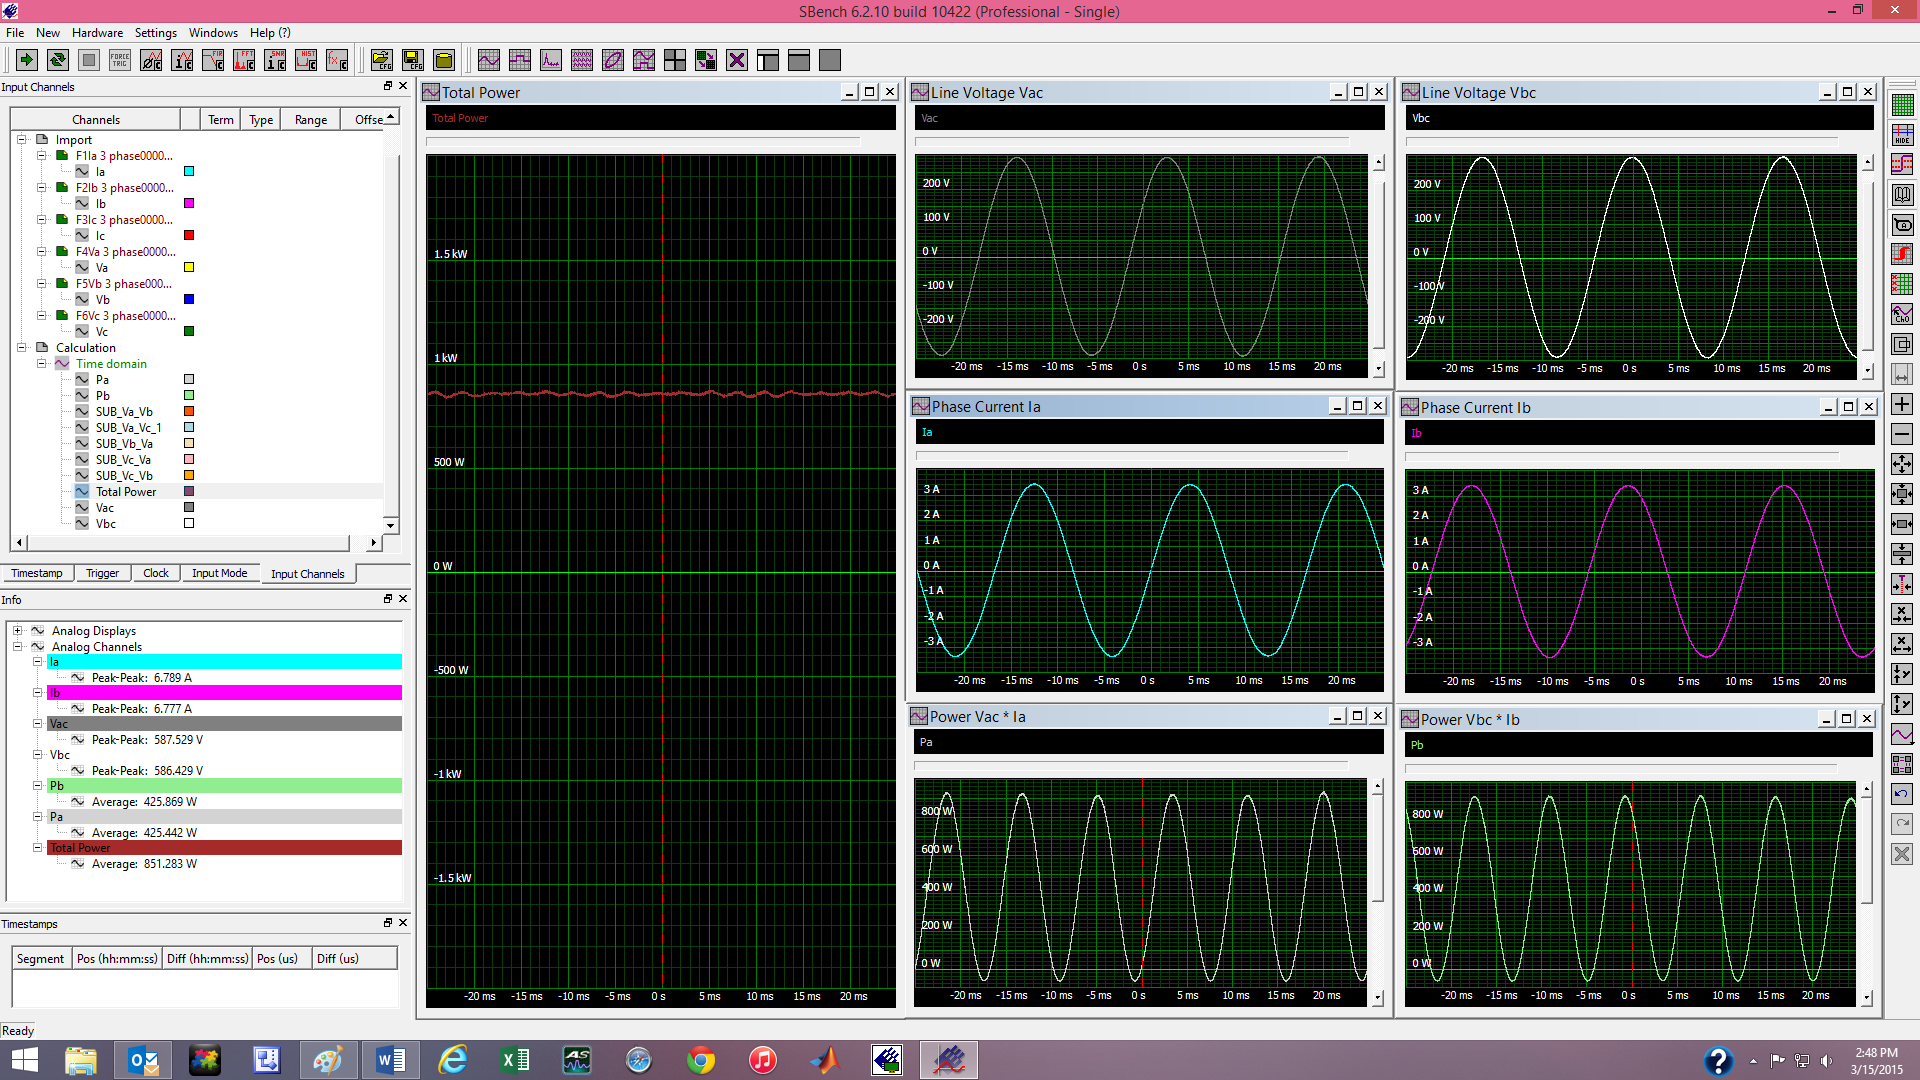 Here is an example of applying the two-wattmeter method which can be accomplished using a four-channel Spectrum digitizer along with two differential voltage and two current probes.
As in the example computing total power based on the individual phase voltages and currents this method uses two line voltages (Vac and Vbc) and two phase currents (Ia and Ib). Line voltages appear in the top row, phase currents appear in the middle row, and the individual power waveforms appear in the bottom row. As before, the total power appears in the leftmost grid marked "Total Power" The average or mean values of each of the power waveforms is shown in the Info grid on the extreme left. Again, the nominal power is 851 Watts.
Conclusion
The basic concepts of AC power measurement have been covered including the definition of instantaneous, real, apparent, and reactive power. Digitizers, with a suitable number of channels, can be employed to measure single and multi-phase power systems employing suitable voltage and current probes. The digitizer?s versatility, ease of communication, and rapid information transfer make it ideal for AC power measurements. Spectrum digitizers are small and compact and are available in a number of different form factors so that they can be used in a wide variety of test setups. For example, the digitizerNETBOX products are designed so that they can be controlled over Ethernet making it possible for them to operate remotely or, in fact, anywhere on a local area network (LAN). PXI cards are available for applications where a mix of modular instruments will work together as part of a complete test system. While PCI and PCIe cards can be installed directly into most modern PC?s turning them into powerful stand-alone test stations.