Core electronic aircraft systems include those for power generation and distribution, as well as those for internal data communication, between all devices and systems within the aircraft, and RF devices for external communication. All the other avionic elements depend on these essential buses for either power or data communications. In this article we will see how modular instruments, be they PCIe, PXIe or LXI, offer the necessary multichannel data acquisition and signal generation capabilities required to test and troubleshoot these systems.
Aircraft data communications buses
There are two standardized data buses used in aircraft. ARINC 429 is a standard bus used primarily in commercial aircraft, while MIL-STD 1553 is commonly used in military aircraft and space vehicles. Both buses use differential signaling to improve noise immunity and signal integrity.
ARINC 429
ARINC 429 is a simpler and lower cost bus using 78 Ω, twisted pair wiring with balanced differential signals. Signal levels are 10 V peak to peak at the transmitter output. A single transmitter or source can be connected to anywhere from 1 to 20 receivers or sinks. The transmission is simplex, from transmitter to receiver, and bidirectional transmission requires two bus channels.
Bus organization uses either star or bus (drop) topology. In star topology, each individual piece of a network is attached to a central hub or switch, and connections are made radially from the transmitter to each receiver. In bus topology, all the devices are connected, via drop lines, to a single cable. Each receiver is therefore connected to a common bus which terminates in the transmitter.
 Transmission from the source to line replaceable units (LRUs) is comprised of 32-bit words containing a 24-bit data field including the actual information and an 8-bit label describing the data itself. LRUs use equipment identification numbers which allows the grouping of equipment into systems. This simplifies system administration.
Sequential words are separated by at least 4-bit times of null or zero voltage. This null interval eliminates the need for a separate clock signal. There are two clock rates for ARINC429 which are 12.5 kHz and 100 kHz.
Data is transmitted in a tri-level bipolar, return-to-zero format. A 10 V transmitted signal is a high state, a 0 V signal is the null-state and a -10 V signal is a low state.
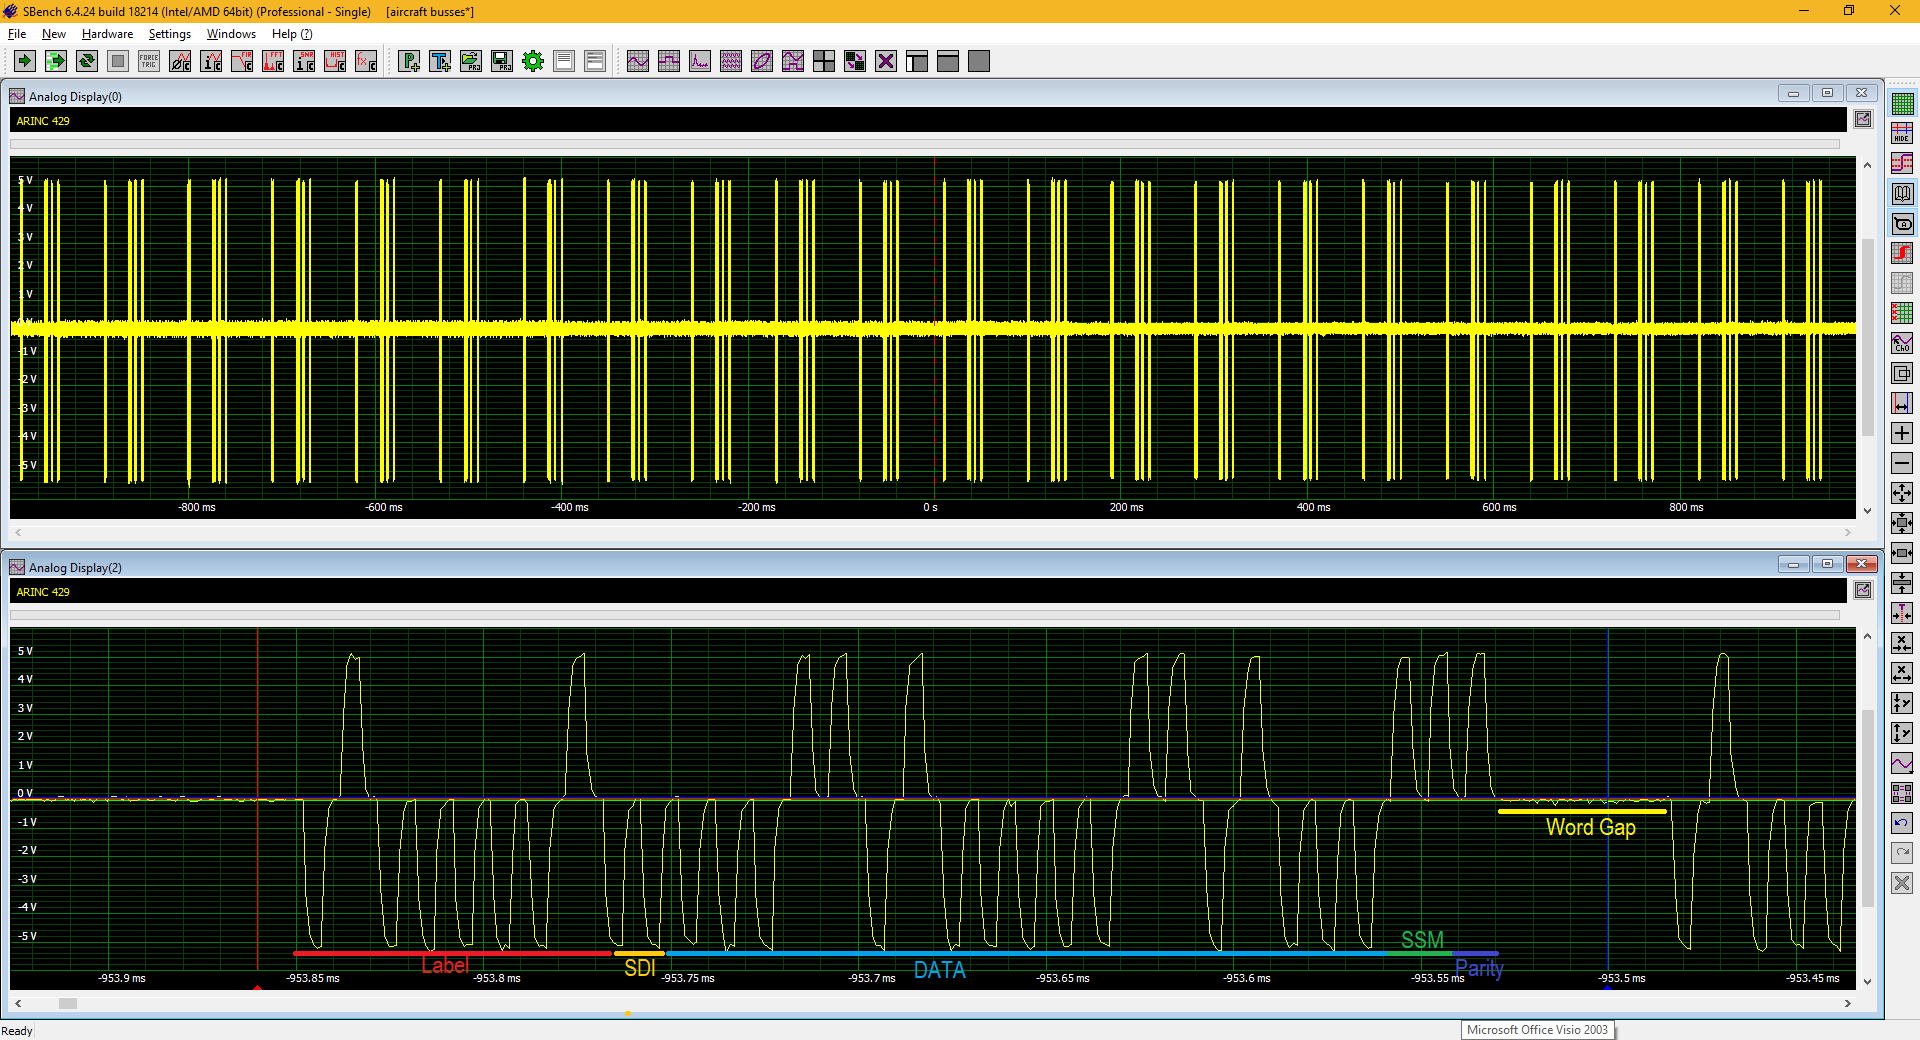
Figure 1 shows an ARINC 429 signal acquired, at the receiver, using a Spectrum Instrumentation M2p.5968-x4 digitizer with 16-bit and 8 channels, and displayed using their SBench 6 interactive measurement software. The M2p.5968-x4 is a modular PCIe card (half size) that can be installed in most PCs or in an external expansion chassis. The input of the card was configured for true differential signal mode, where two channels are internally combined and the difference between the two lines, without regard to system ground, is measured and presented as a single waveform.
ARINC 429 signals are generally quite lengthy. For example, the trace in the upper grid shows a two second acquisition. The M2p.5968-x4 card has a 512 Mega-Sample (MS) internal memory and can sample signals at rates anywhere from 1 kS/s up to 125 MS/s. As such, a single channel acquisition made at 1 MS/s, using all 512 MS of memory, could have a duration of up to 512 seconds.
 The horizontally expanded view in the lower grid shows the tri-level return-to-zero data structure. The colored lines at the bottom of the grid have been added to mark the data fields associated with a single message. Starting at the left is the label (red line). This is followed by the source/destination identifier (SDI) in gold. The SDI field is used to identify the receiver intended for the data. To the right of the SDI field is the data field marked in light blue. The sign/status field (SSM) is marked in green. The SSM field information indicates the hardware status, the operational mode, or the data content validity. The final field is the parity bit in dark blue. ARINC transmissions use odd parity.
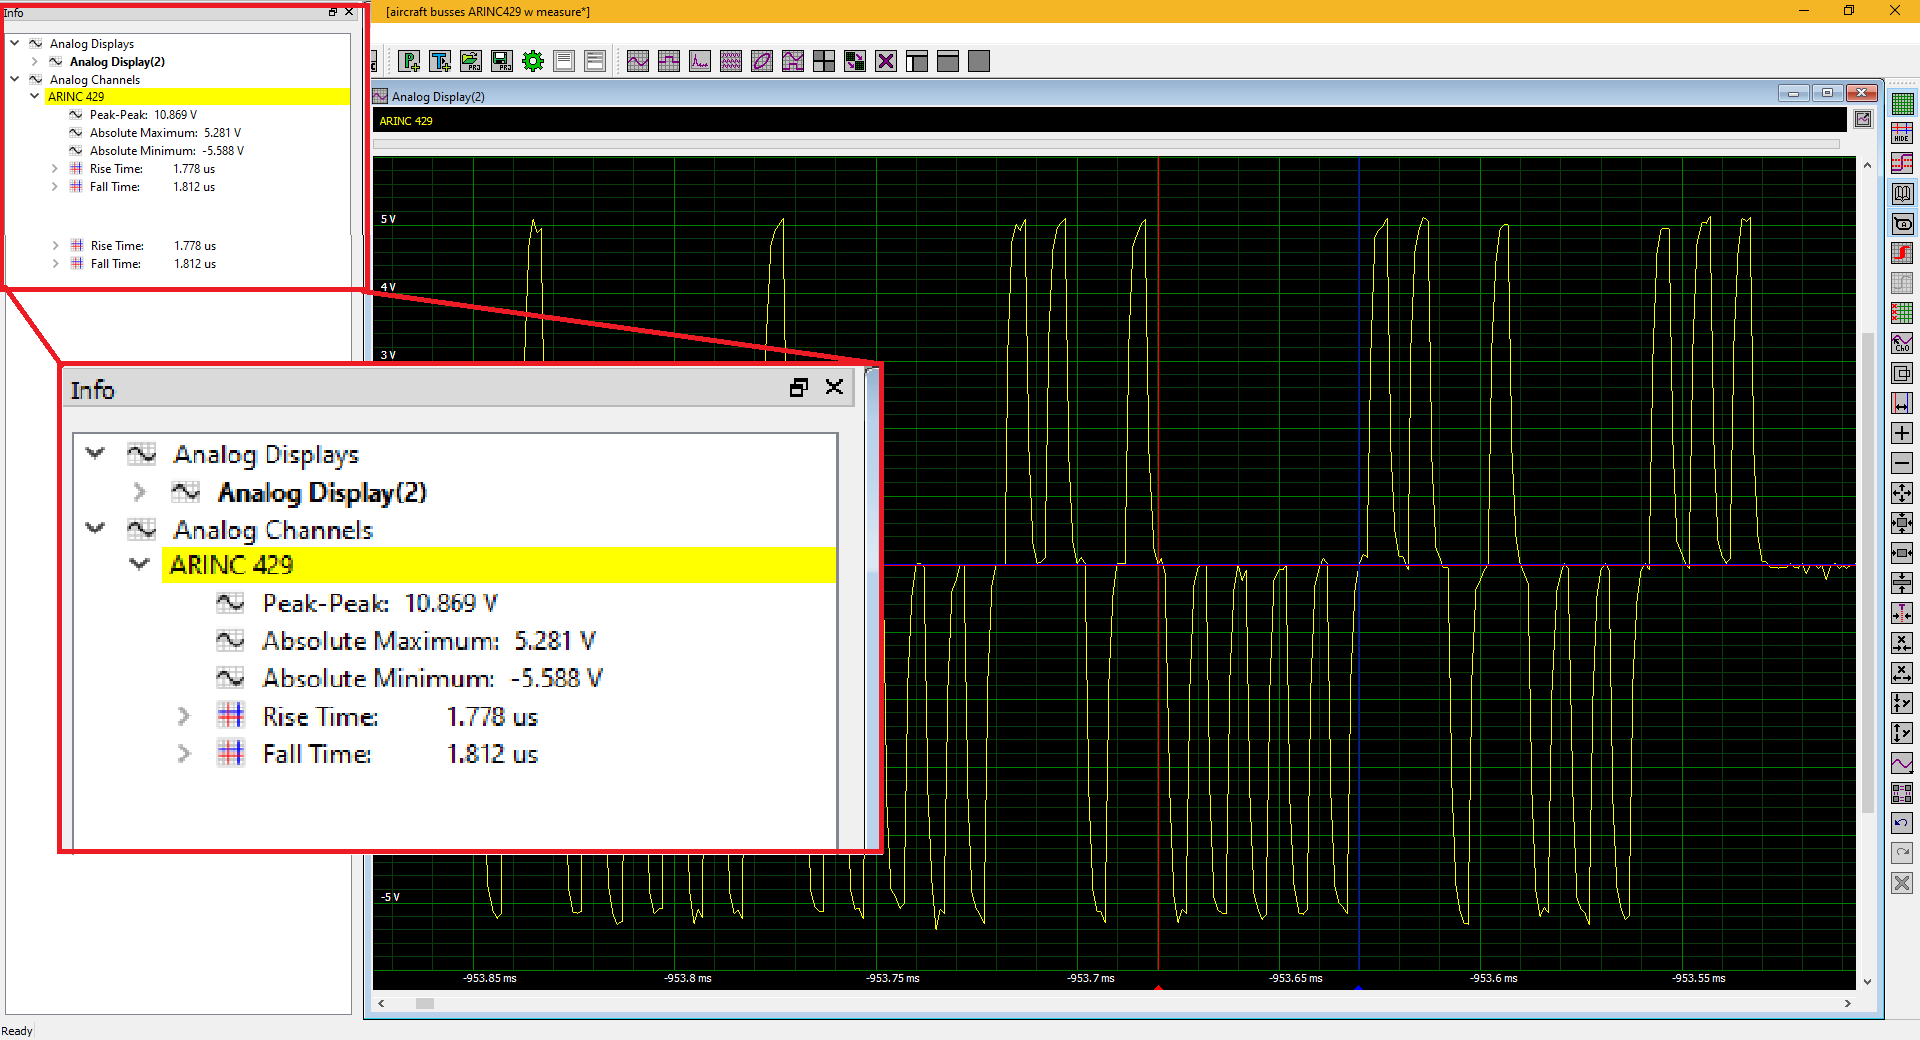
Physical layer measurements can be performed on the acquired waveforms using the SBench6 software, as shown in Figure 2.
The peak-to-peak amplitude, maxima and minima of the entire waveform are measured as well as the rise time and fall time of the pulse between the red and blue cursors. The ARINC 429 specification calls for the rise and fall times to be 1.5 ± 0.5 µs for the 100 kHz clock rate. The measured values are within those limits.
Digitizers are ideal instruments for measuring physical layer attributes like voltage levels and timing. However, decoding and interpretation of the data content usually requires additional computing power. Modular digitizers, like the one used here, offer high data transfer rates so that long waveforms can be rapidly transferred to a computer for interpretation. For example, the M2p.5968-x4 has a transfer speed over the PCIe bus of 700 MBytes/s and can stream data in FIFO mode directly to CPUs and GPUs for processing. Creating customized test programs is possible as the digitizer family is supported by drivers and examples for common computer programming languages. This includes C/C++, VB.NET, C#, J#, Java, Julia and Python, as well as IVI, LabVIEW and MATLAB.
MIL-STD 1553C
MIL-STD 1553C is the current version of a military data bus used in aircraft, space craft and combat vehicles. It is a bi-directional, dual redundant bus using differential signaling at a clock rate of 1 Mbit/s that supports up to 31 remote terminal devices. There are three types of devices that can be connected, a bus controller, a remote terminal (RT) or a bus monitor. A single bus controller on the bus initiates commands and responses to the remote terminals. Bus activity can be observed and recorded by a bus monitor.
 All devices are interconnected over two separate buses in normal operation. Only the primary bus is used, but the secondary bus is available in the case of a primary bus failure. The bus wiring consists of 70-80 Ω shielded twisted pairs. Each device may be connected to the buses using a direct connection or via, most commonly used, a transformer coupling.
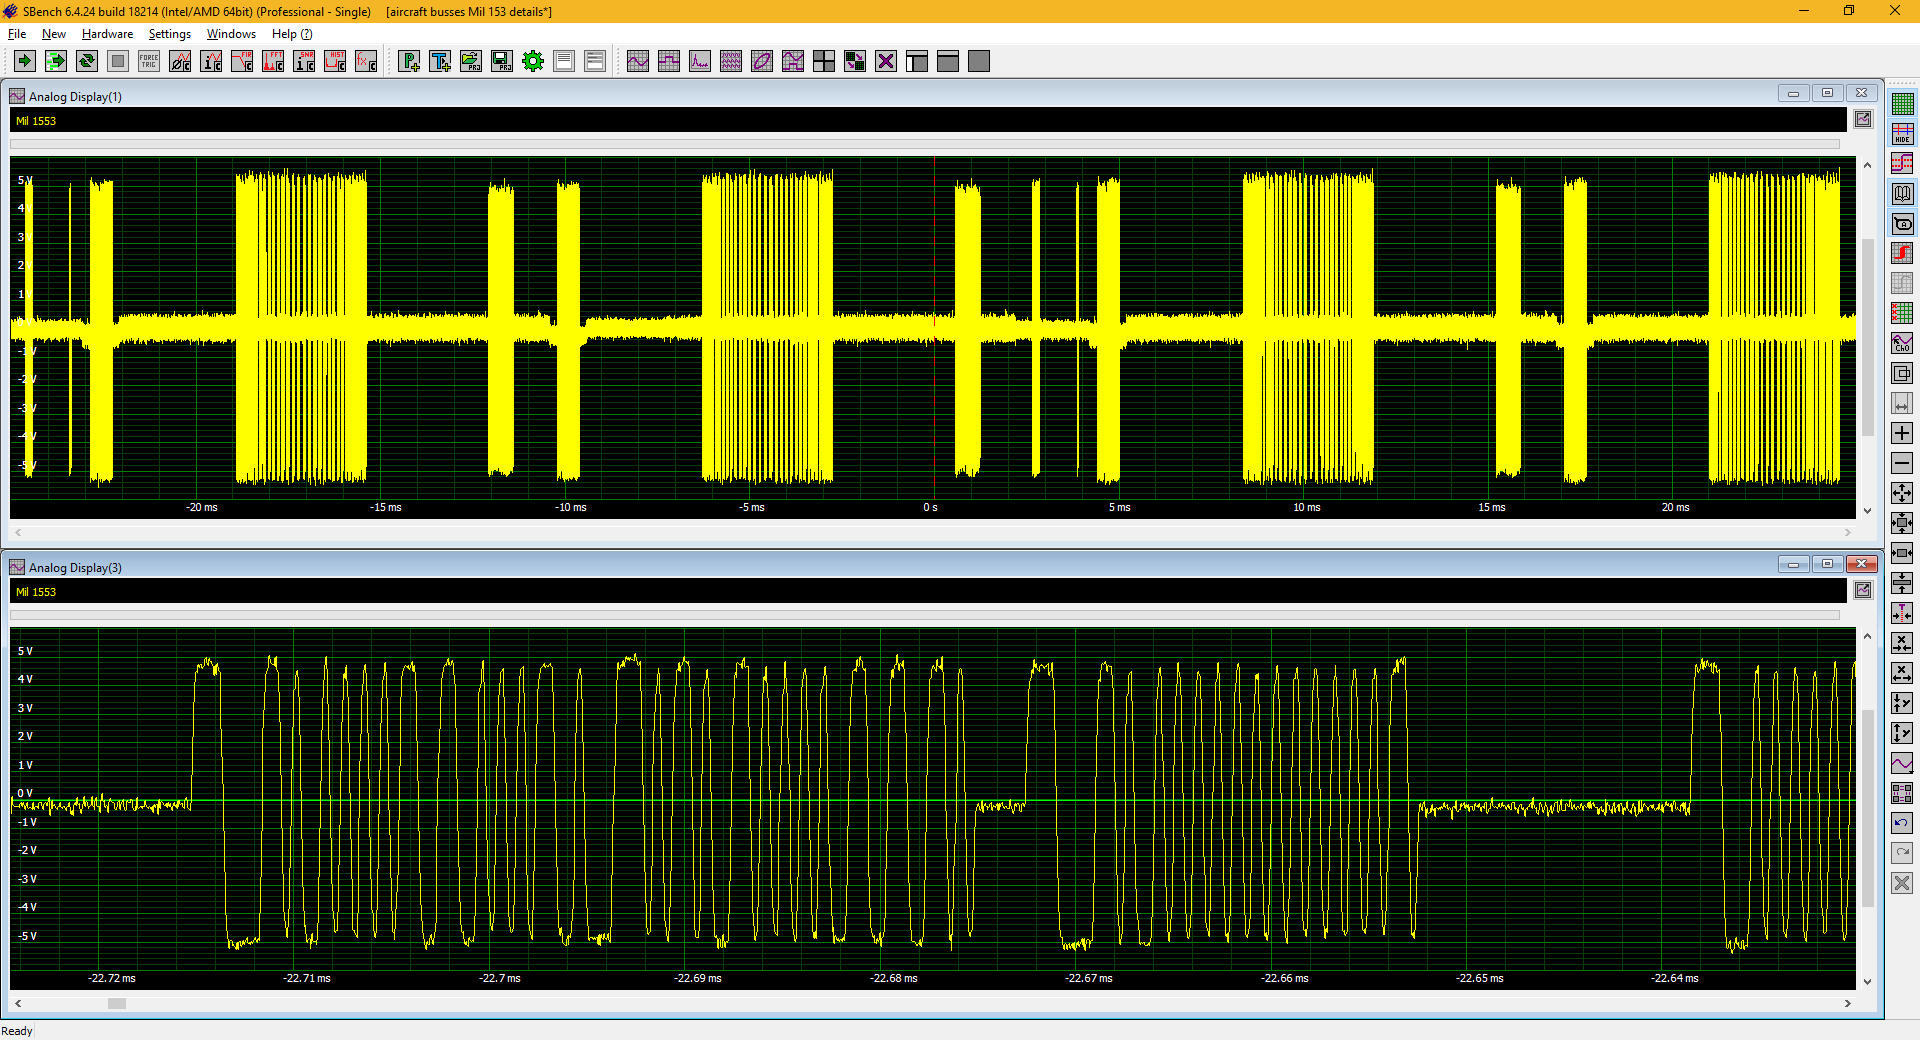
MIL-STD 1553 encodes the data using Manchester coding. An example of a MIL-STD 1553 acquisition is shown in Figure 3.
The Manchester encoding uses a bipolar signal where a transition through zero occurs in the center of each bit cell. A transition from a negative voltage to a positive voltage signifies a zero, while a transition from positive to negative represents a logical one.
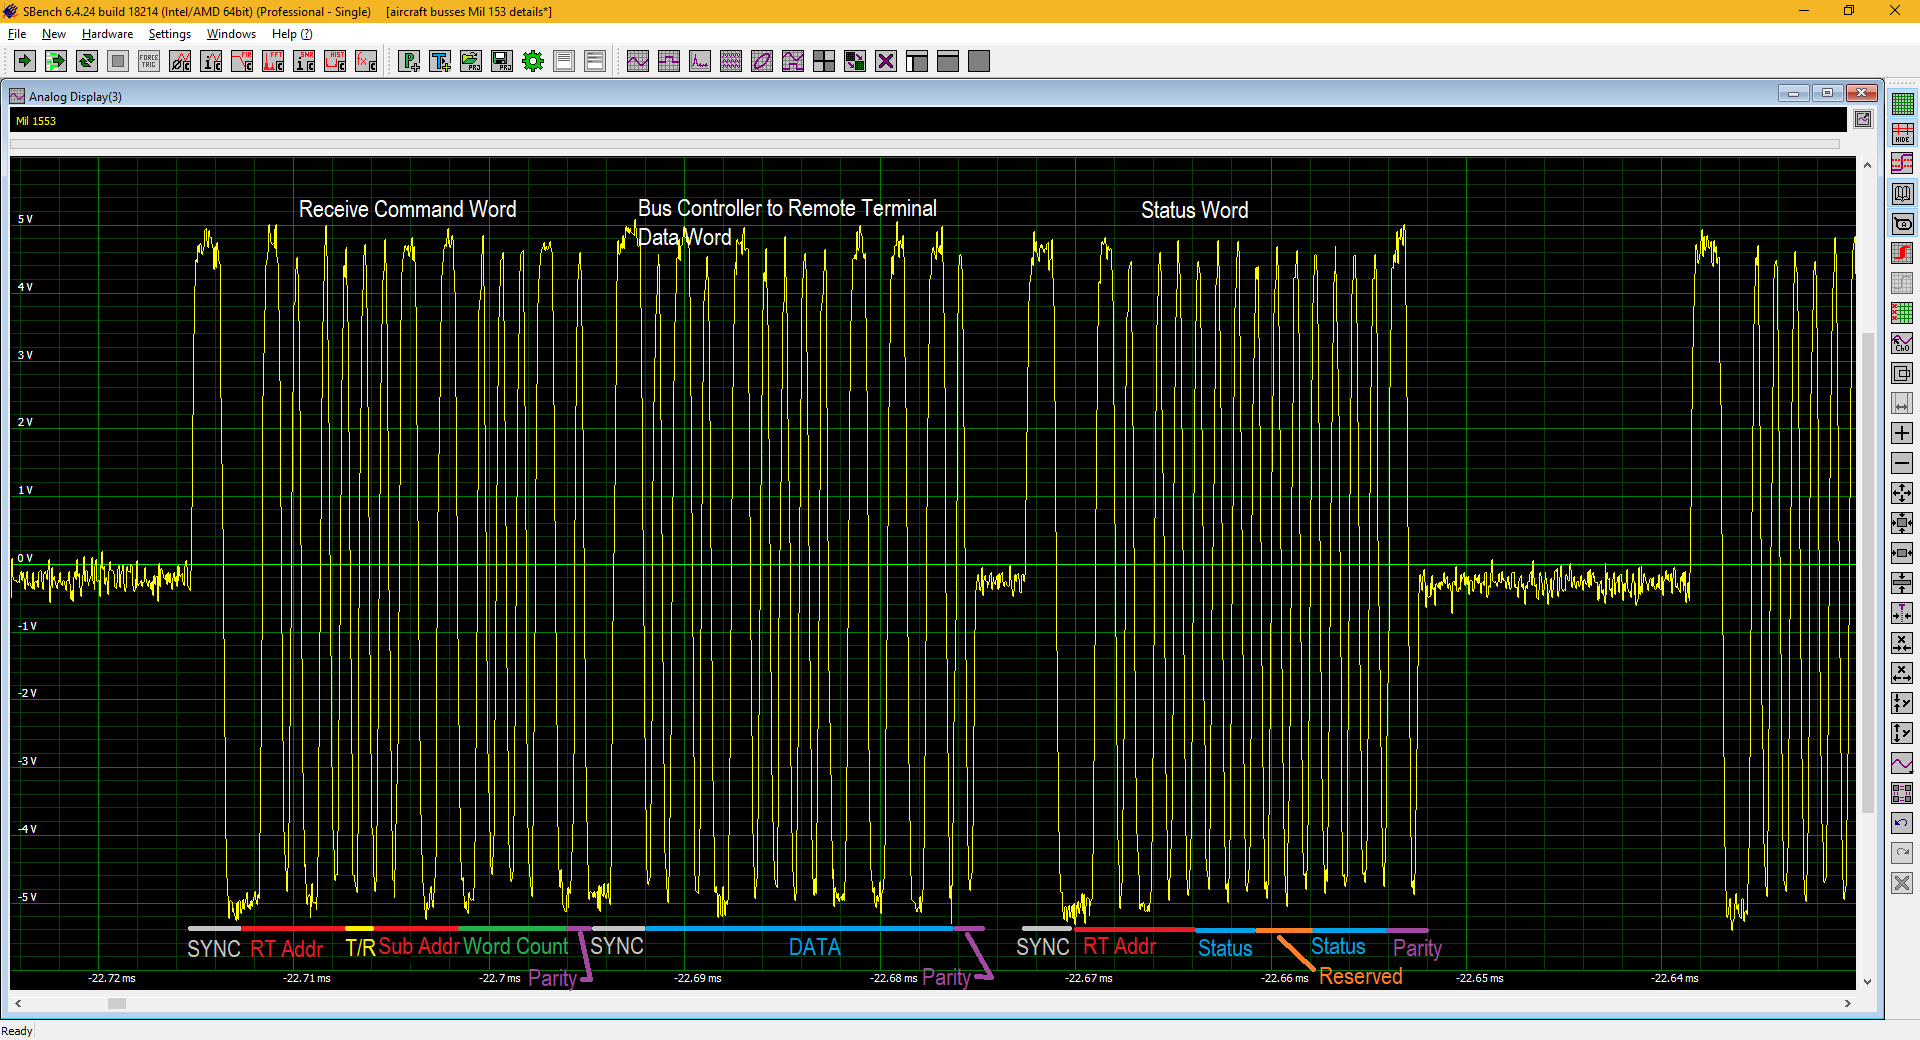 There are three types of words, Command, Data and Status. Each word is 20 bits in length. Figure 4 breaks down a typical bus event.
Each transmission starts with a sync pulse. The sync pulse has a duration of three-bit times (3 µs). It begins as a positive pulse for the first half and transitions to a negative level for the second half of the sync period. The command word addresses the remote terminal and any of its 31 sub addresses and indicates the addressed remote to receive. The command word ends with a parity bit. MIL-STD 1553 also uses odd parity. The data word follows the command. It begins with a sync signal and includes the data being transferred to the remote and a parity bit. The final word is the status word from the remote terminal indicating the status of the transfer. The gap between the data word and the status word is the response time of the remote terminal.
As in the case of the ARINC 429 bus, the physical layer signal characteristics can be measured, or the data can be moved to a computer for decoding and detailed analysis.
Power analysis
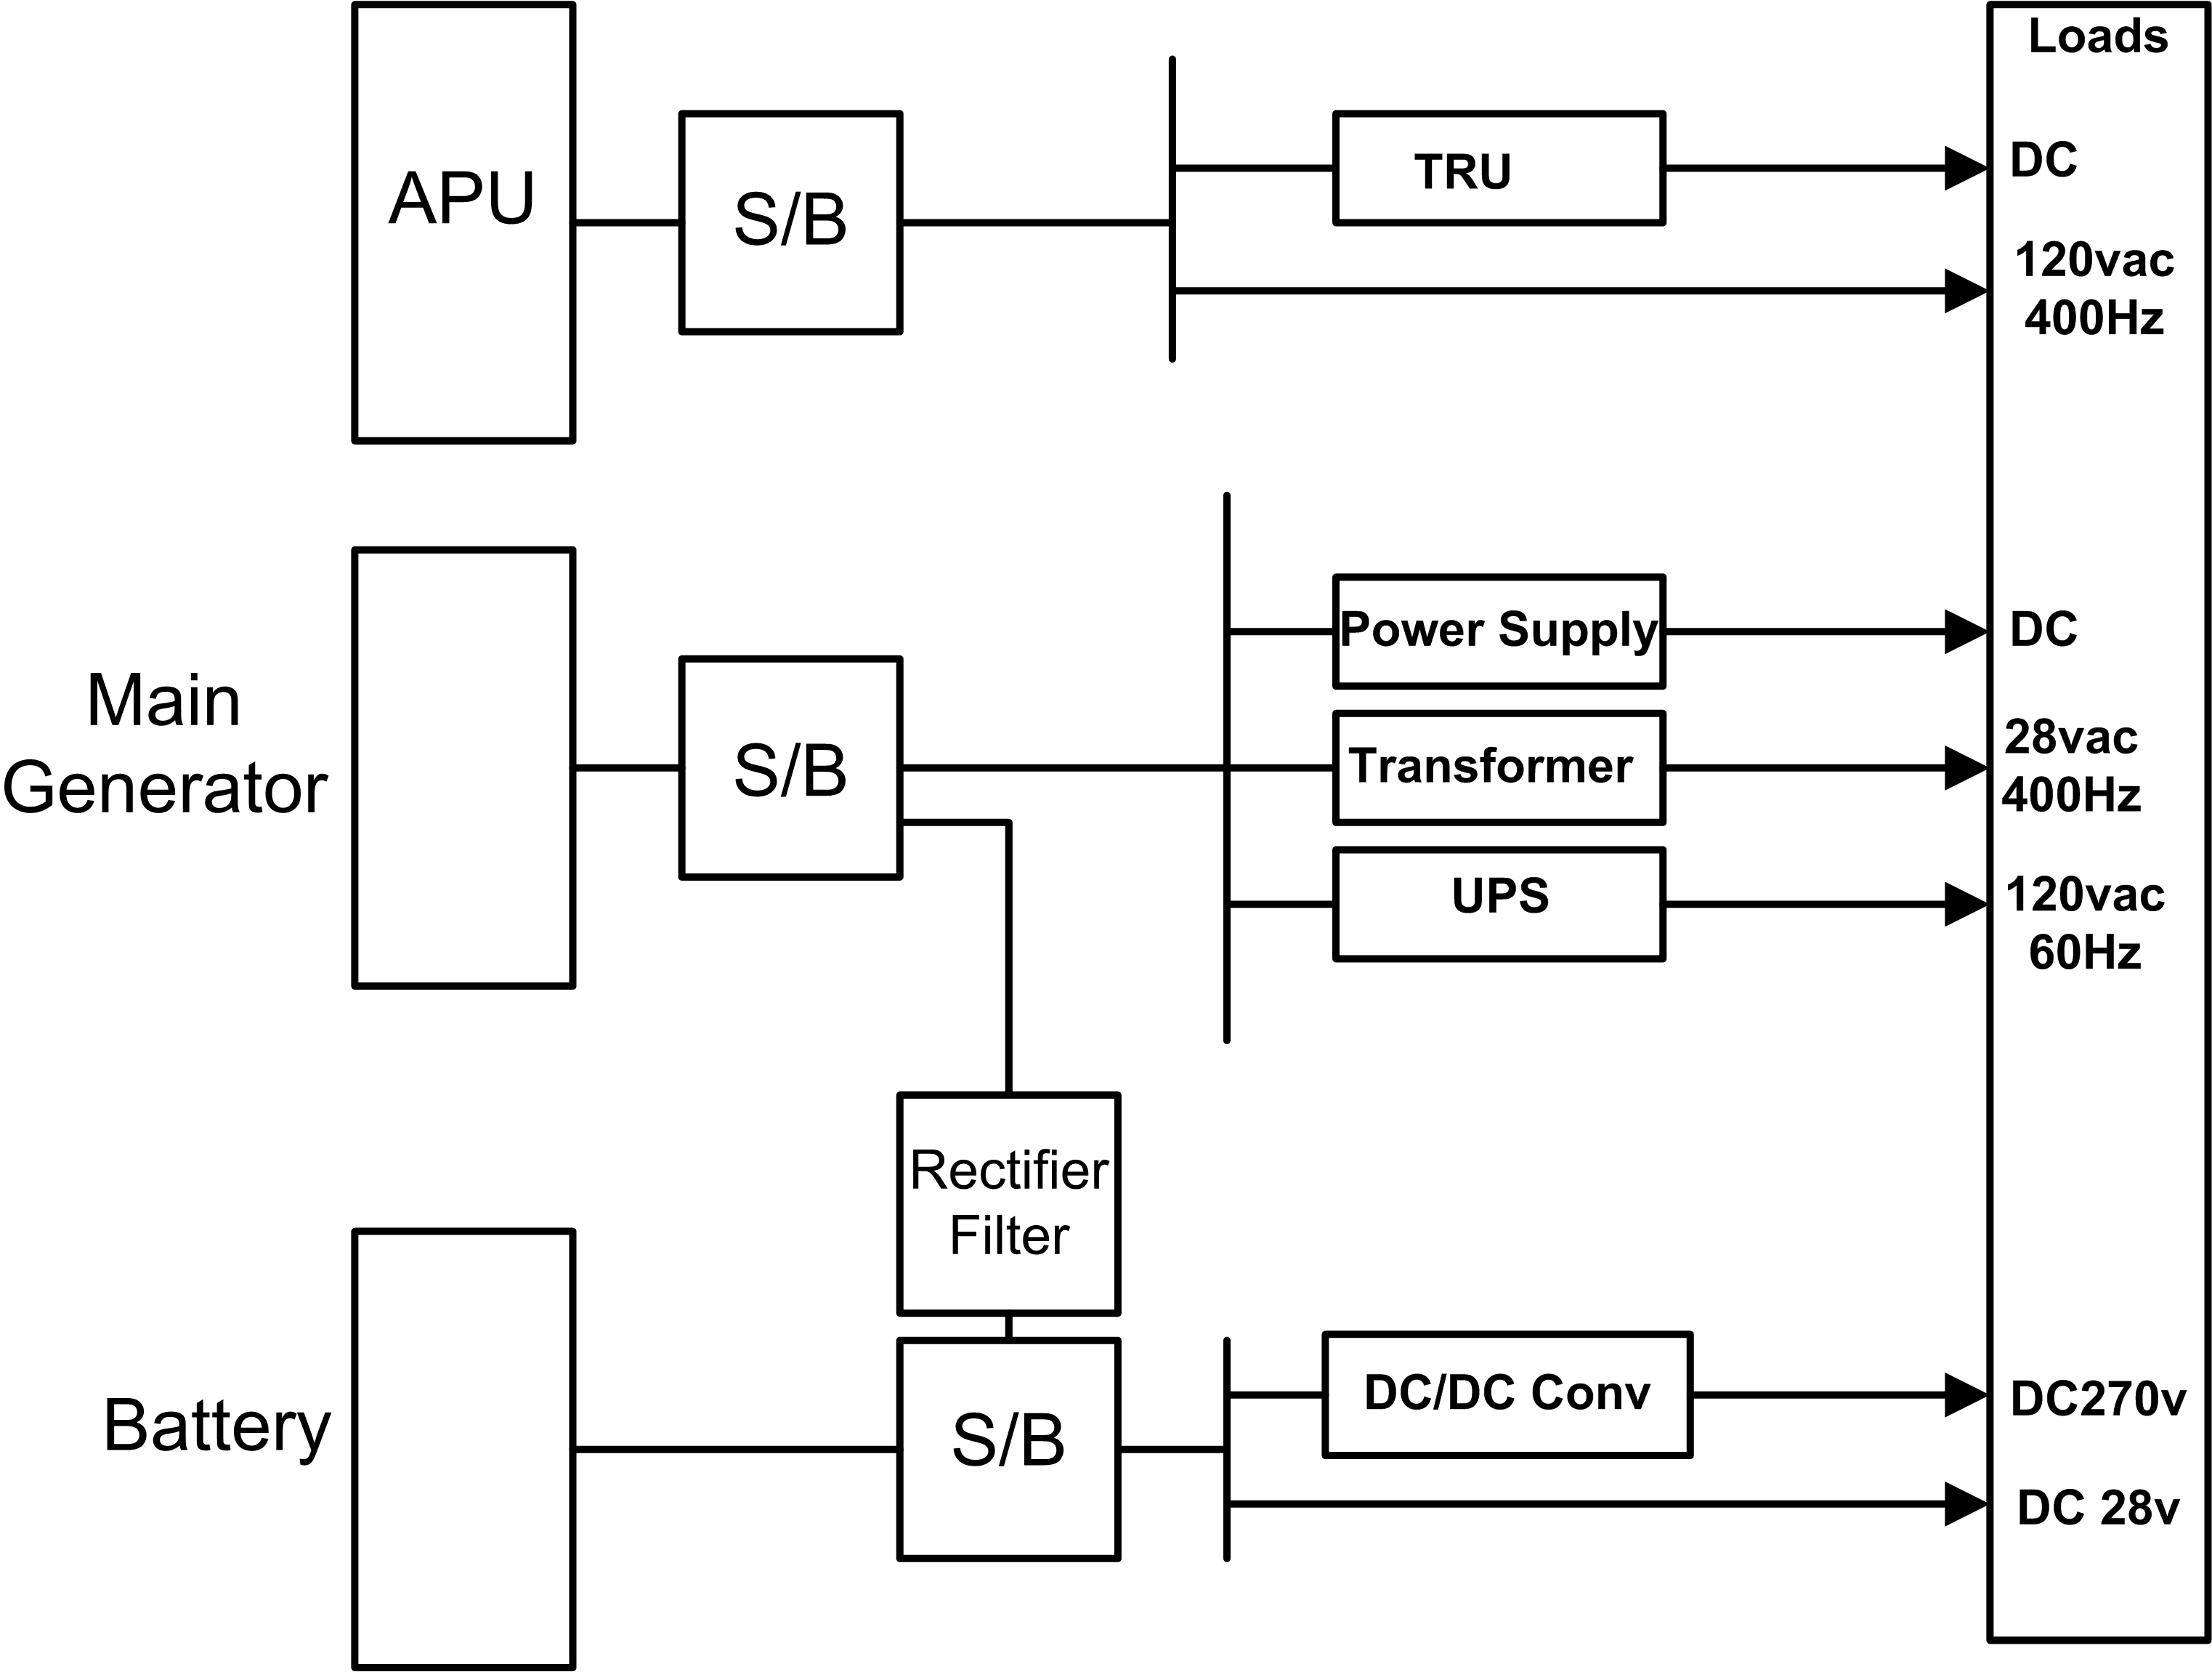 Aircraft power systems vary greatly depending on the size and complexity of the aircraft. Aviation electrical systems are usually multiple voltage systems using a combination of AC and DC buses to power a variety of aircraft components. Primary power generation is normally AC, using alternators, with one or more Transformer Rectifier Units (TRU) with rectification and filtering to provide DC voltage for equipment requiring DC power. Secondary AC generation from an auxiliary power unit (APU) is usually provided for use on the ground, when the engines are idle, and for airborne use in the event of component failure. Reliability is a key concern and critical AC and DC components are wired to specific buses, and special provisions are made to provide power to these buses under almost all failure situations. In the event that all AC power generation is lost, a static Inverter is included in the system so the essential AC bus can be powered from the aircraft batteries. A typical aircraft power system is diagrammed in Figure 5.
Modular digitizers are ideally suited for making both AC and DC power integrity measurements as multiple voltages and currents can be monitored. The ability to make differential measurements, like those with the M2p.5968-x4, allows ground isolation which is a helpful feature when measuring current. Common measurements include voltage, current, power, efficiency, ripple voltage, load regulation, input regulation harmonic content, power on and power off sequence.
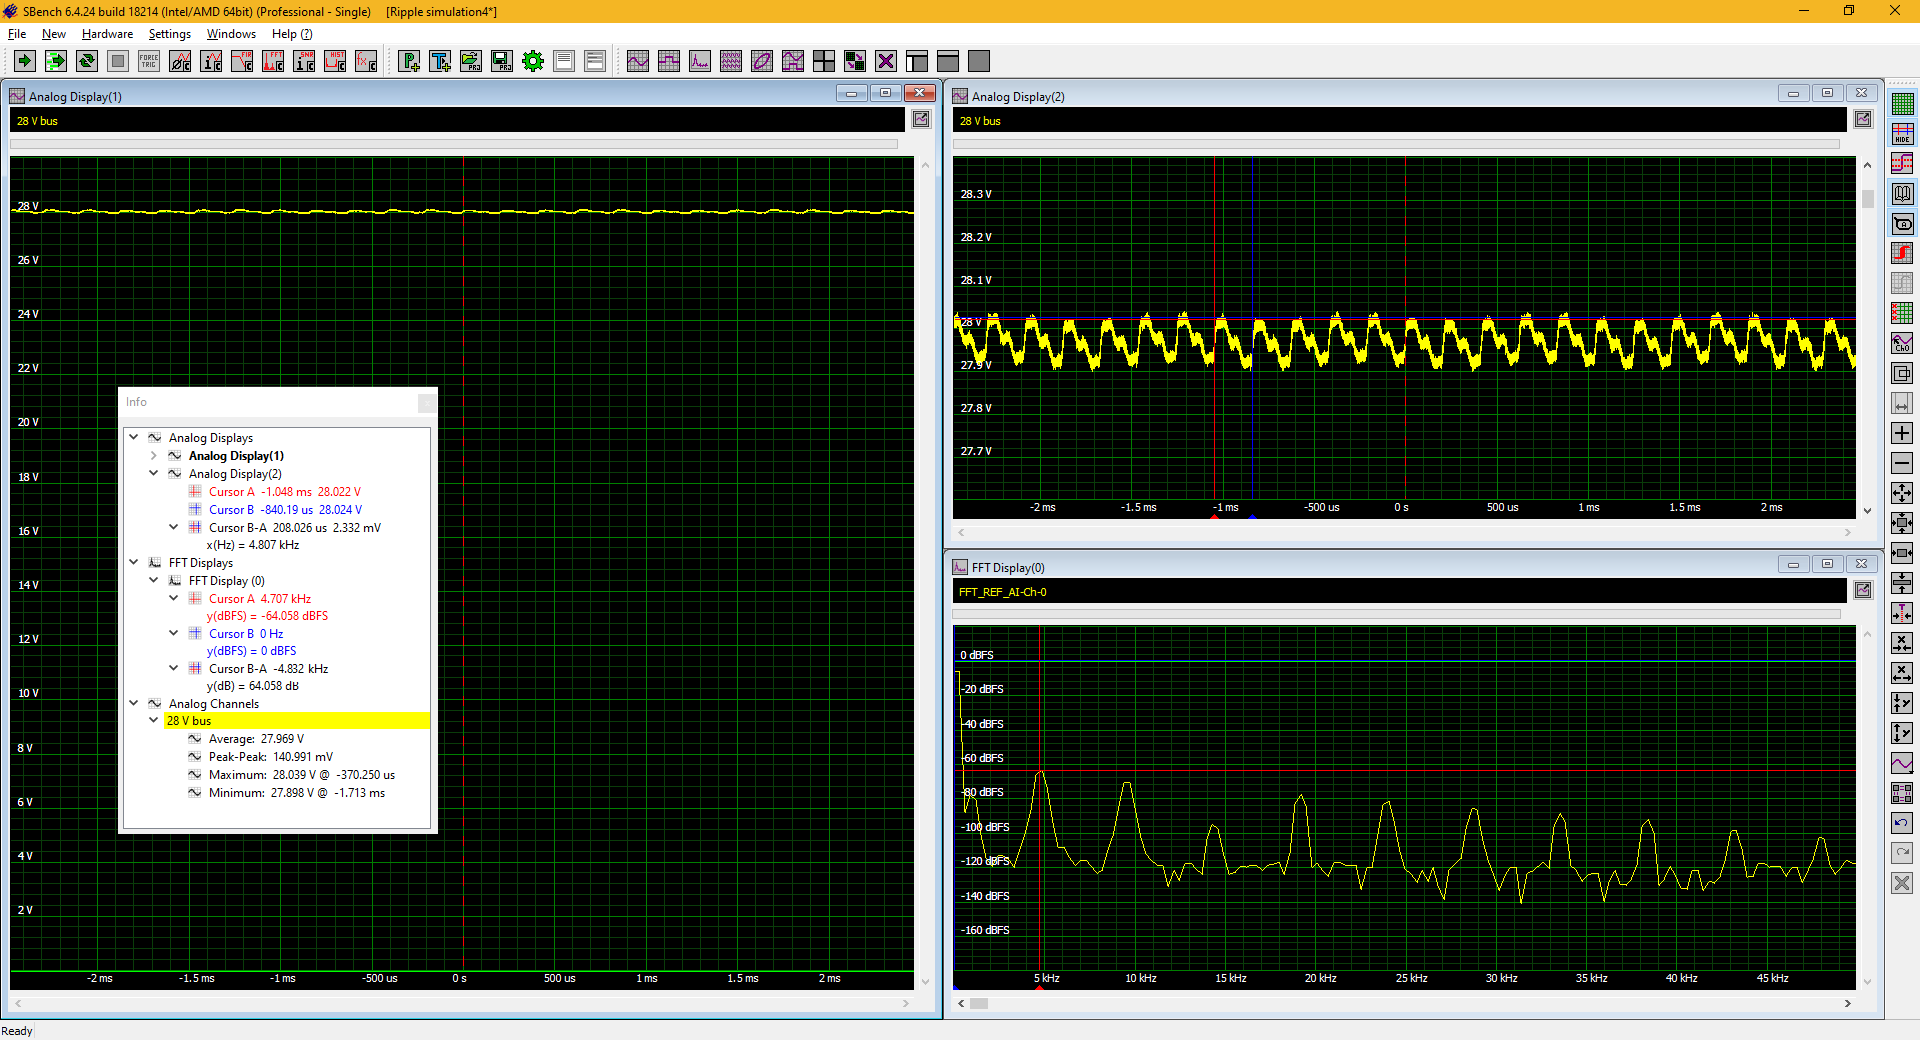 As an example of a common power integrity measurement, we will consider a ripple voltage measurement on a 28 V DC bus, as shown in Figure 6.
The acquired waveform in the left grid shows the DC voltage on a 30 V full scale display. The average value of the waveform, shown in the info panel is 27.969 V. The upper right grid is a vertically expanded view. Cursors measure the frequency of the ripple as being 4807 Hz. The peak-to-peak ripple is measured and shown in the Info panel as 140.991 mV. The bottom right grid contains the Fast Fourier Transform (FFT) of the ripple voltage. It shows a fundamental frequency of 4800 Hz along with multiple harmonics and a few spurious frequencies.
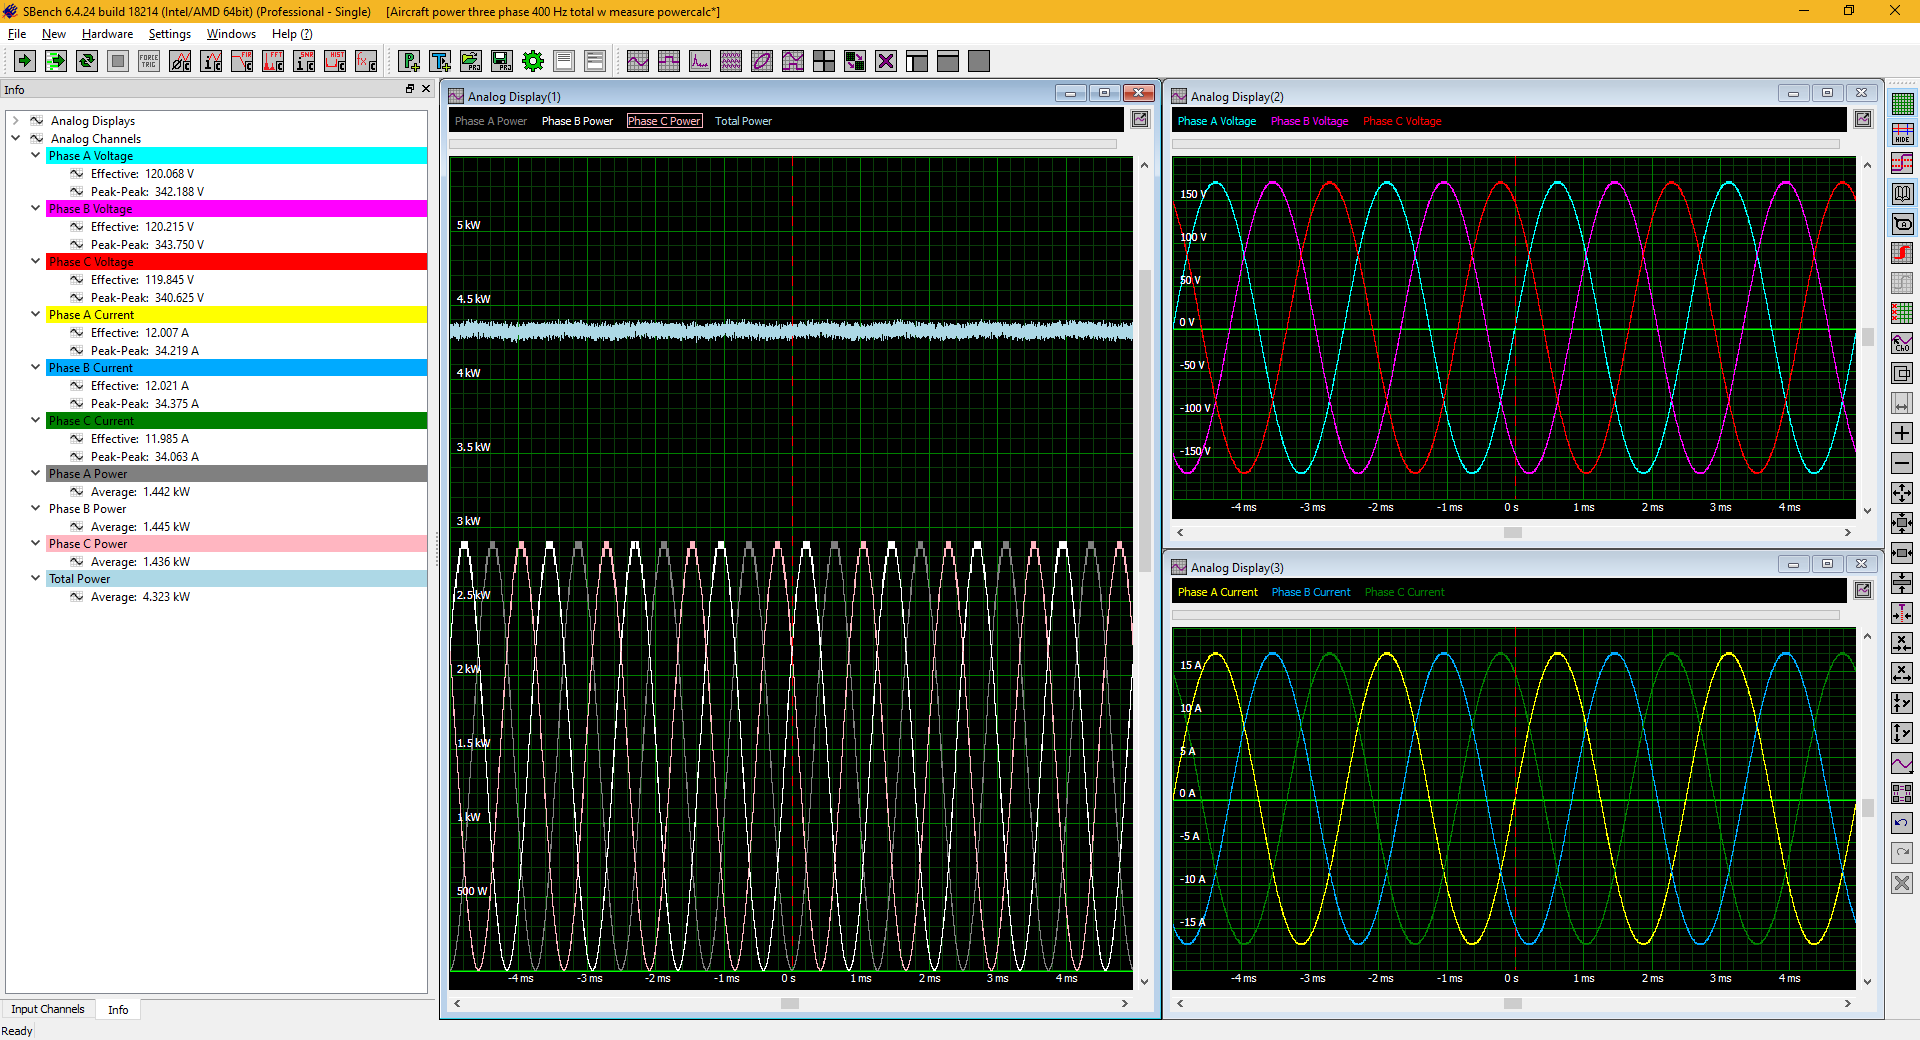
The AC voltage sources are mostly three phase 400 Hz, and modular digitizers allow measurement of phase voltage and current, line voltage and current, power, frequency, harmonic content. Figure 7 is an example of a three-phase measurement of voltages, currents and power.
The three phase voltages (A, B, and C) of the 120 V bus are overlaid on a common grid which shows the 120° phase difference between them. Measurements of the effective and peak-to-peak voltage of each phase are recorded in the info panel to the left. The effective or RMS voltage is nominally 120 V, and the peak-peak-voltage is 340 V. The phase currents are also displayed on a common grid with identical phases relationships to each other. The power factor of the load causes a phase difference between the voltage and current waveforms. In this experiment a pure resistive load is used resulting a phase difference of 0°.
The power per phase is calculated using the product of the voltage and current of each phase. The total power is the sum of the individual phase powers.
These are just a sample of the many measurements that can be made on aircraft power buses.
RF Measurements
 Aircraft also use a broad range of RF based devices from radio communication, altimeters, navigation aids and radar. RF measurements require modular instruments with greater bandwidths, an example is the Spectrum Instrumentation model M4i.2230-x8. This is a PCIe based, single channel, 8-bit digitizer with a 1.5 GHz bandwidth and 5 GS/s maximum sample rate. This bandwidth and sample rate are compatible with direct acquisition of VHF and lower UHF devices and the intermediate frequencies of many higher frequency devices. The digitizer includes 4 Giga-Samples (GS) of acquisition memory. A 4 GS memory can acquire 800ms of data at the maximum sampling rate of 5 GS/s. This provides good time resolution over long acquisitions which is helpful in interpreting phase or frequency modulated signals.
As a simple example consider the measurement of the Pulse Repetition Frequency (PRF) of a 1 GHz radar as shown in Figure 8.
 The radar signal is acquired with a sampling rate of 5 GS/s for a 500 µs duration using 2.5 MS of acquisition memory. The acquired signal is amplitude demodulated by squaring the acquired signal and then low pass filtering the squared signal. The detected amplitude envelope is easily measured. The info panel at the left shows the pulse repetition frequency of 10 kHz, a pulse width of 9.955 µs and a duty cycle of 9.955%.
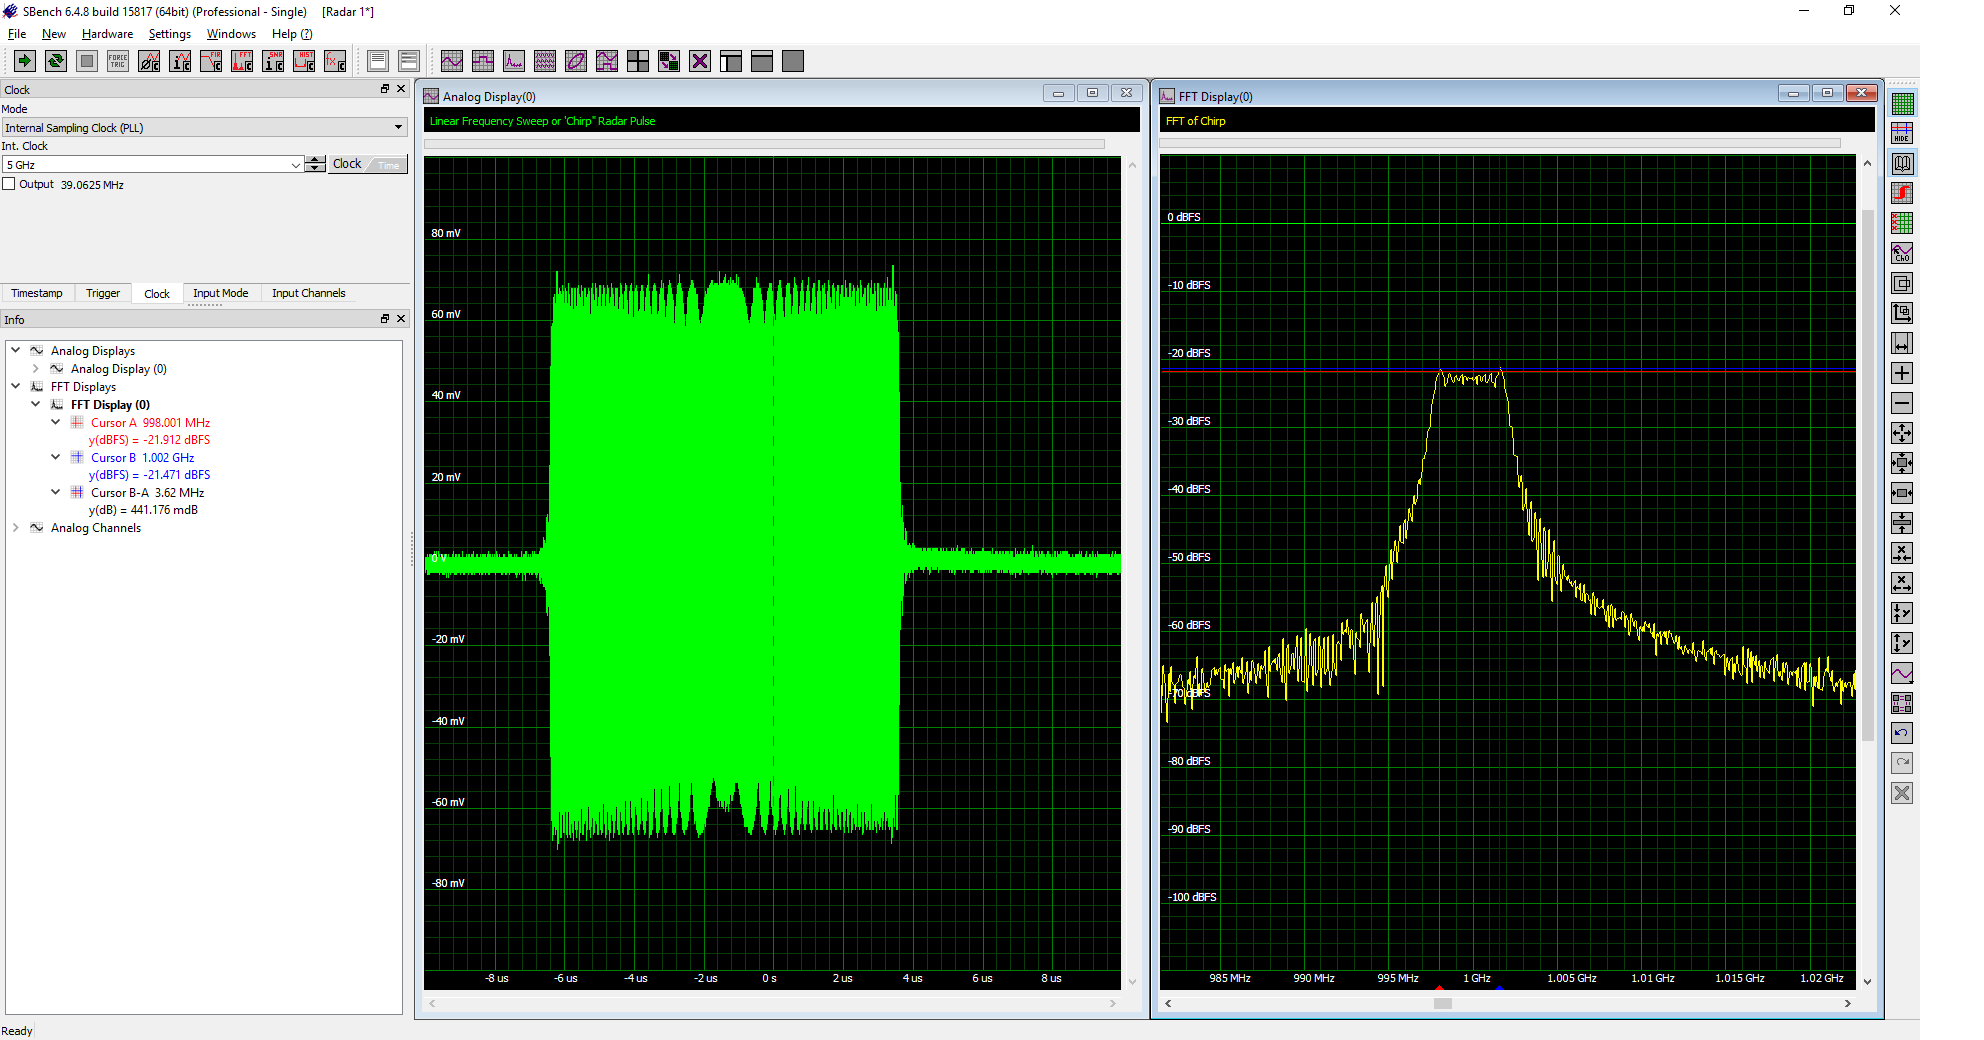
The FFT can be used to show the frequency domain view of a frequency modulated chirp radar pulse as displayed in Figure 9.
The RF carrier of the radar is frequency modulated with a linear ramp. The FFT shows the range of the frequency excursion. The carrier is shifted from 998 MHz to 1002 MHz over the duration of the 9.95 µs pulse.
These are a couple of common RF measurements that can be made with modular digitizers. More sophisticated processing and measurement can be accomplished by transferring the acquired waveform to a computer for further analysis.
Portable or fixed modular instrument systems
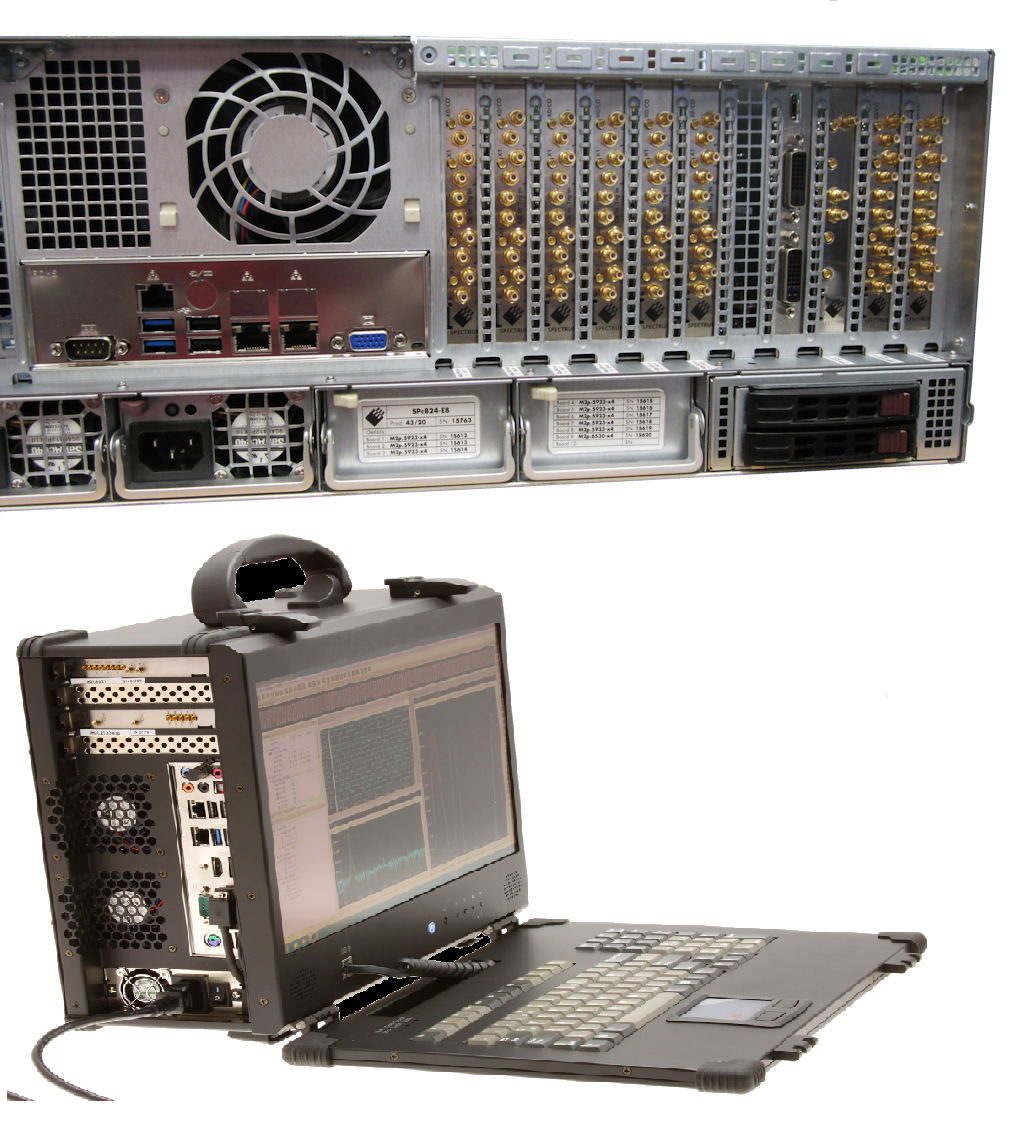 Testing aircraft systems requires some flexibility in test system architecture. Modular instruments offer themselves to a great deal of packaging flexibility. Figure 10 shows both a high-capacity modular test system intended for multiple channels and fixed applications, as well as a portable system.
There are many other choices between these two examples. Users can configure test systems to match their measurement needs and venue. Modular digitizers are perfect for analogue signal acquisition but they also work well with other modular instruments such as Arbitrary Waveform Generators (AWGs), for analogue signal generation, and Digital I/O cards that can both acquire or generate high speed digital signals. This makes it possible to create customized test systems or even simulation platforms for a wide range of core electronic aircraft systems.
Conclusion
Modular instruments are very compatible with aircraft measurements be they data communications, power distribution or RF processing. Their main advantages are multiple measurement channels (up to hundreds of channels), long acquisition records, single and differential inputs and also compatible sampling rates and bandwidth. The compact dimensions of modular instruments allow them to be installed in portable computers for on-site or mobile measurements.
Downloads
Application note as pdf