The use of lower voltage rails in current integrated circuits requires power supply designs with tighter dynamic specifications for those supplies. In addition, multi-rail power supplies require test instruments that can analyze multiple channels simultaneously. They must also provide very high dynamic range (up to 16 bits) and acquire very long records with high time resolution. Modular digitizers fill this need offering 16 bit digitizers with up to 256 channels and record lengths to 512 Mega Samples.
The low cost of modular digitizers compared to stand-alone test equipment such as oscilloscopes combined with their ability to transfer large amounts of data in a very short time align them with production test applications.
This article will investigate a number of external power supply tests made using modular digitizers and show how the digitizer's capabilities can be applied to these tests.
Basic Tests
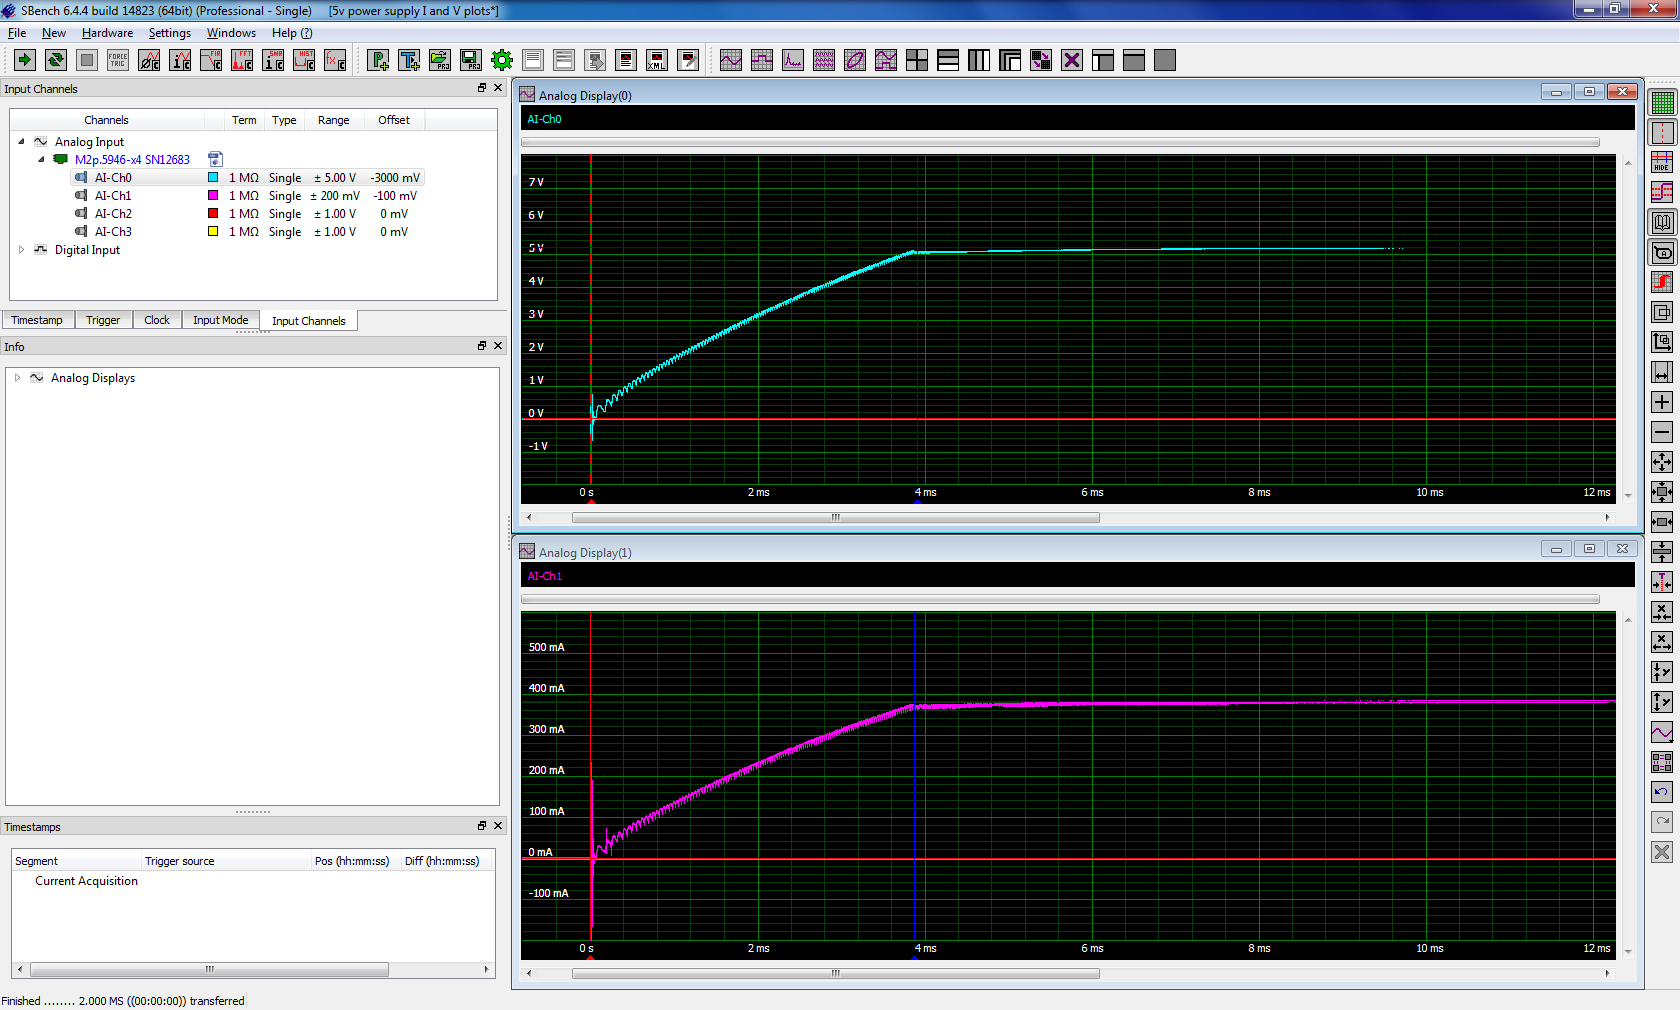 Power supply testing involves measuring voltage and current waveforms. The most basic test is to apply power to the power supply in a controlled manner and to capture and analyze the output voltage and load current of a power supply. Figure 1 is an example of a basic measurement of a 5 volt, wall adapter power supply using a Spectrum M2p.5946-x4 4 channel, 16 bit, 80 MS/s digitizer.
The output voltage (upper trace) is measured directly using a 1:1 voltage probe connected across the power supply output. The current waveform is derived from the voltage across a 0.5 Ω shunt resistor in series with the power supply load. The input channels of the digitizer can be configured as single ended or differential topology. The differential connections are ideal for measurements of the voltage across current shunts. The Spectrum SBench 6 software, used for this example, has the ability to rescale the voltage data by the value of the shunt resistor and render the vertical axis of the display in milli amperes (mA) so it can be read directly as a current as shown in the figure. In this case the nominal steady state load current is 381 mA.
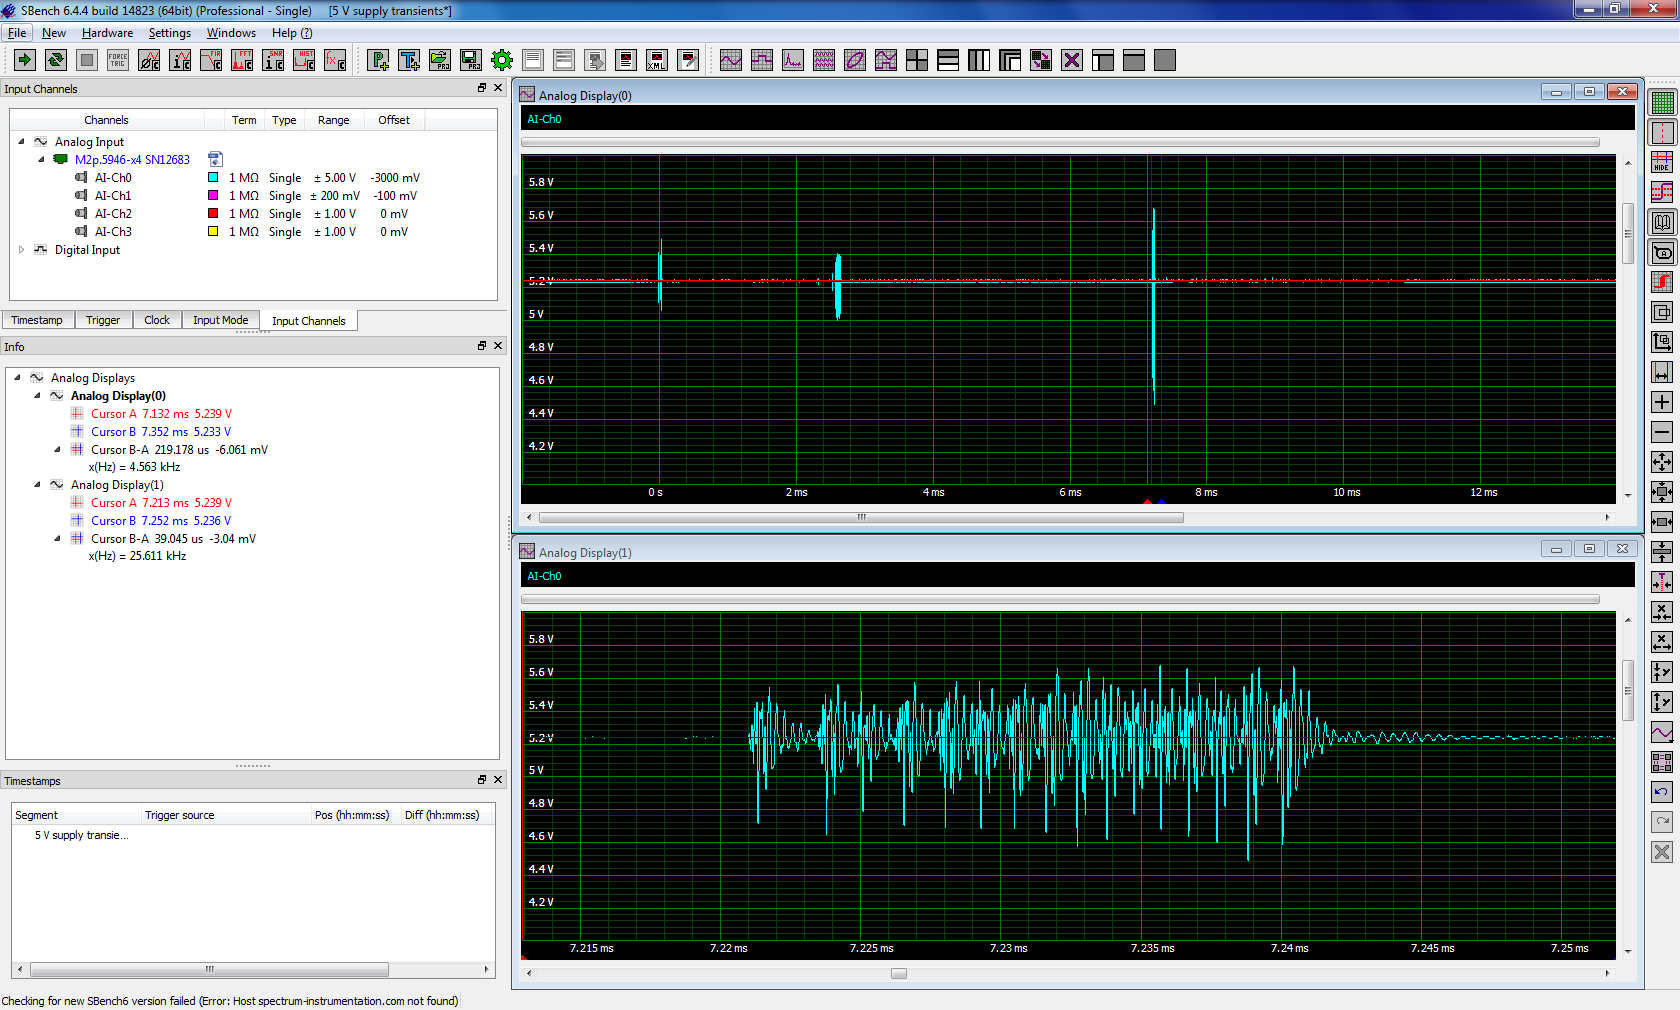 The power supply output comes up to the rated voltage in about 4 ms. The waveforms are acquired at 80 Mega samples per second (MS/s) and the time resolution of the waveforms is 12.5 ns per sample. While the duration of this waveform is 12.5 ms, equivalent to 1 million samples, the digitizer has a 512 Mega Sample acquisition memory which could acquire up to 6.4 s of data at this same sample rate. This is extremely important if you have to expand the waveform traces to see the details of a waveform event. Consider the waveform from this same power supply acquired while seeing the effects of line (mains) transients on the output voltage (Figure 2).
The digitizer was set up to trigger if the output voltage level of the supply dropped below 5.18 volts. The upper trace is the raw acquisition showing three transient bursts. The largest amplitude burst on has been expanded horizontally (lower trace) to enable viewing of the structure of the transient. The horizontal minor divisions on the lower trace are 1 µs apart. The transients consist of a series of damped quasi-sinusoidal bursts spaced at nominally 1.4 µs. Due to the long record length the acquired waveform retains all this detail which is extremely important when investigating issues like this transient.
Load and Line Regulation
Load regulation measures the ability of the supply to respond to changes in the output load. Ideally the output voltage should not change when the load changes. Figure 3 shows a load regulation test with a load of 25 Ohms on a nominal 5 V supply. The step load is captured by triggering the digitizer when the nominal 5.23 volt output drops below 5.2 volts. In this case the voltage drops to 5.2 volts when the 200 mA load is applied. The load regulation is calculated using this equation:
Load Regulation (%) = 100% *( (VNo load - Vload) / Vload )
In this example the load regulation works out to 0.63 %.
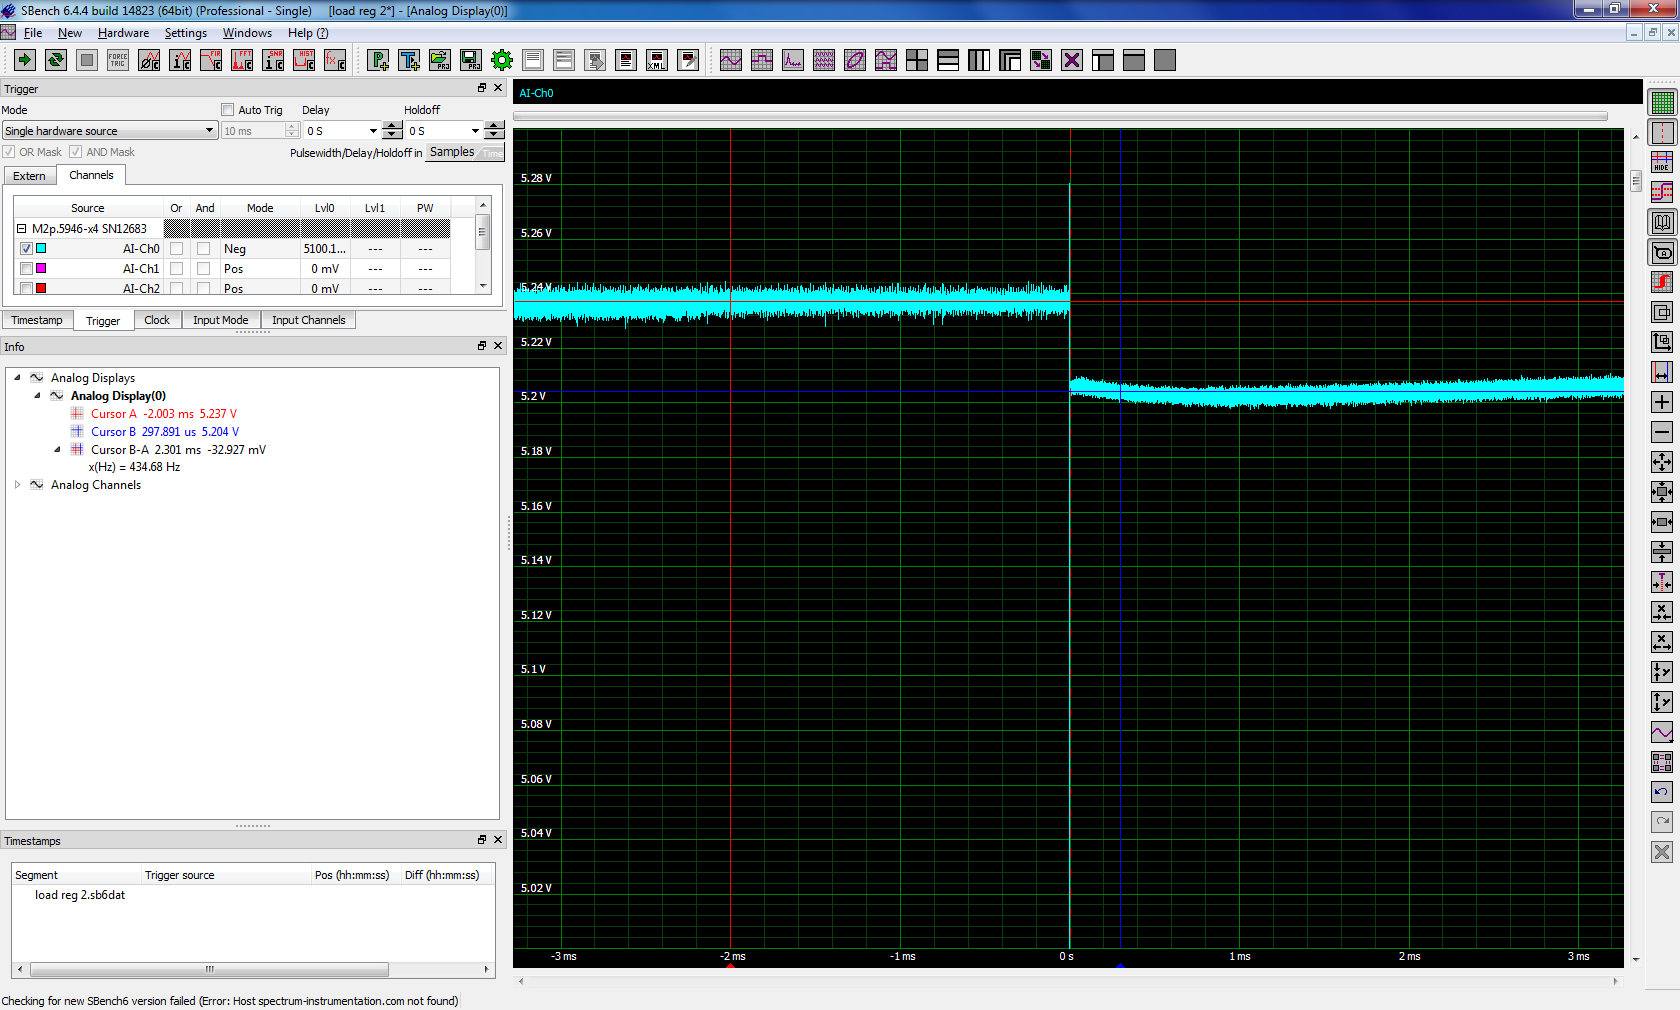 The load regulation test can also reveal issues with the power supply's control loop. Overshoot and ringing of the output in response to a load step is an indication of possible instability in the supply's control loop. This power supplies' response is well damped.
In addition to a digitizer this test requires a way to increment the load. This could be a resistive load bank or an electronic load.
Similar testing of line regulation involves changing the input line voltage and observing the changes in the output.
Line Regulation = 100% (VOUT Hi - VOUT low) / (VLINE Hi - VLINE Low)
Line regulation measures the ability of the supply to maintain the output voltage in spite of variations in the input line voltage. This test requires a method of changing the input line voltage to the supply. This could be a simple as an auto-transformer or as complex as a programmable AC source.
Periodic and Random Deviation
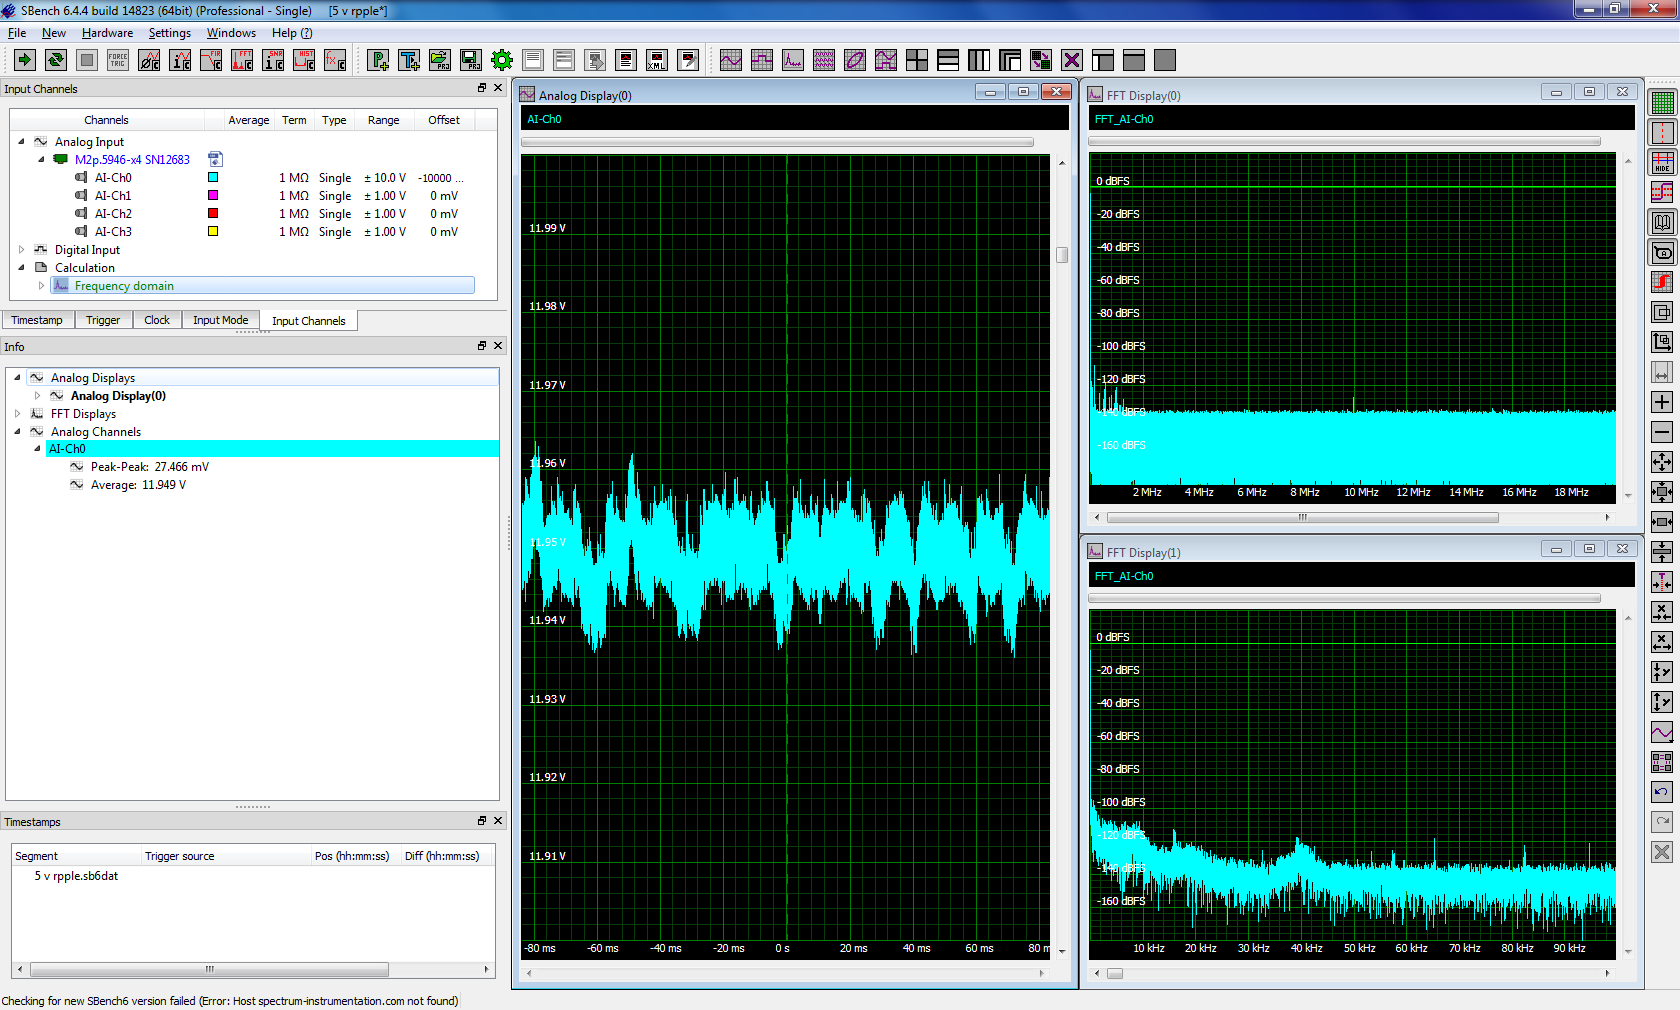 Periodic and random deviation (PARD) includes ripple and noise and is a measure of the deviation of the output rail from the average or nominal value. Ripple and noise can have adverse effects on circuit performance causing timing jitter and other anomalous behavior. Figure 4 illustrates the PARD of a 12 volt supply. The time waveform is in the left hand grid. The Fast Fourier Transform (FFT) of the PARD signal is in the two right hand grids. PARD is usually analyzed over a bandwidth of 0 to 20 MHz as shown in the upper right grid. Most of the energy in the ripple of this supply is in the frequency range below 100 kHz (Lower right trace). Periodic ripple appears as vertical lines in the FFT. Noise, which is a broad band signal, is mapped as a rise in the FFT baseline
Measurements of the average and peak to peak amplitude of the time domain signal appear in the info pane on the left side of the figure. The peak to peak ripple is 27.5 mV on an average supply rail voltage of 11.95 volts. This highlights another advantage of high resolution digitizers, having sufficient dynamic range to measure the ripple voltage which is -53 dB below the nominal 12 volt level. An eight bit oscilloscope only has a theoretical dynamic range of 48 dB and a practical dynamic range of about 40 dB and would not be able to render the ripple without using a DC block in order to use a more sensitive input range. This will block the high DC level but has the disadvantage of attenuating low frequency ripple and noise components. Alternatively, a specialized probe with large offset capabilities can be employed to cancel the large DC component, this adds cost to the oscilloscope measurement.
Power Rail Sequencing
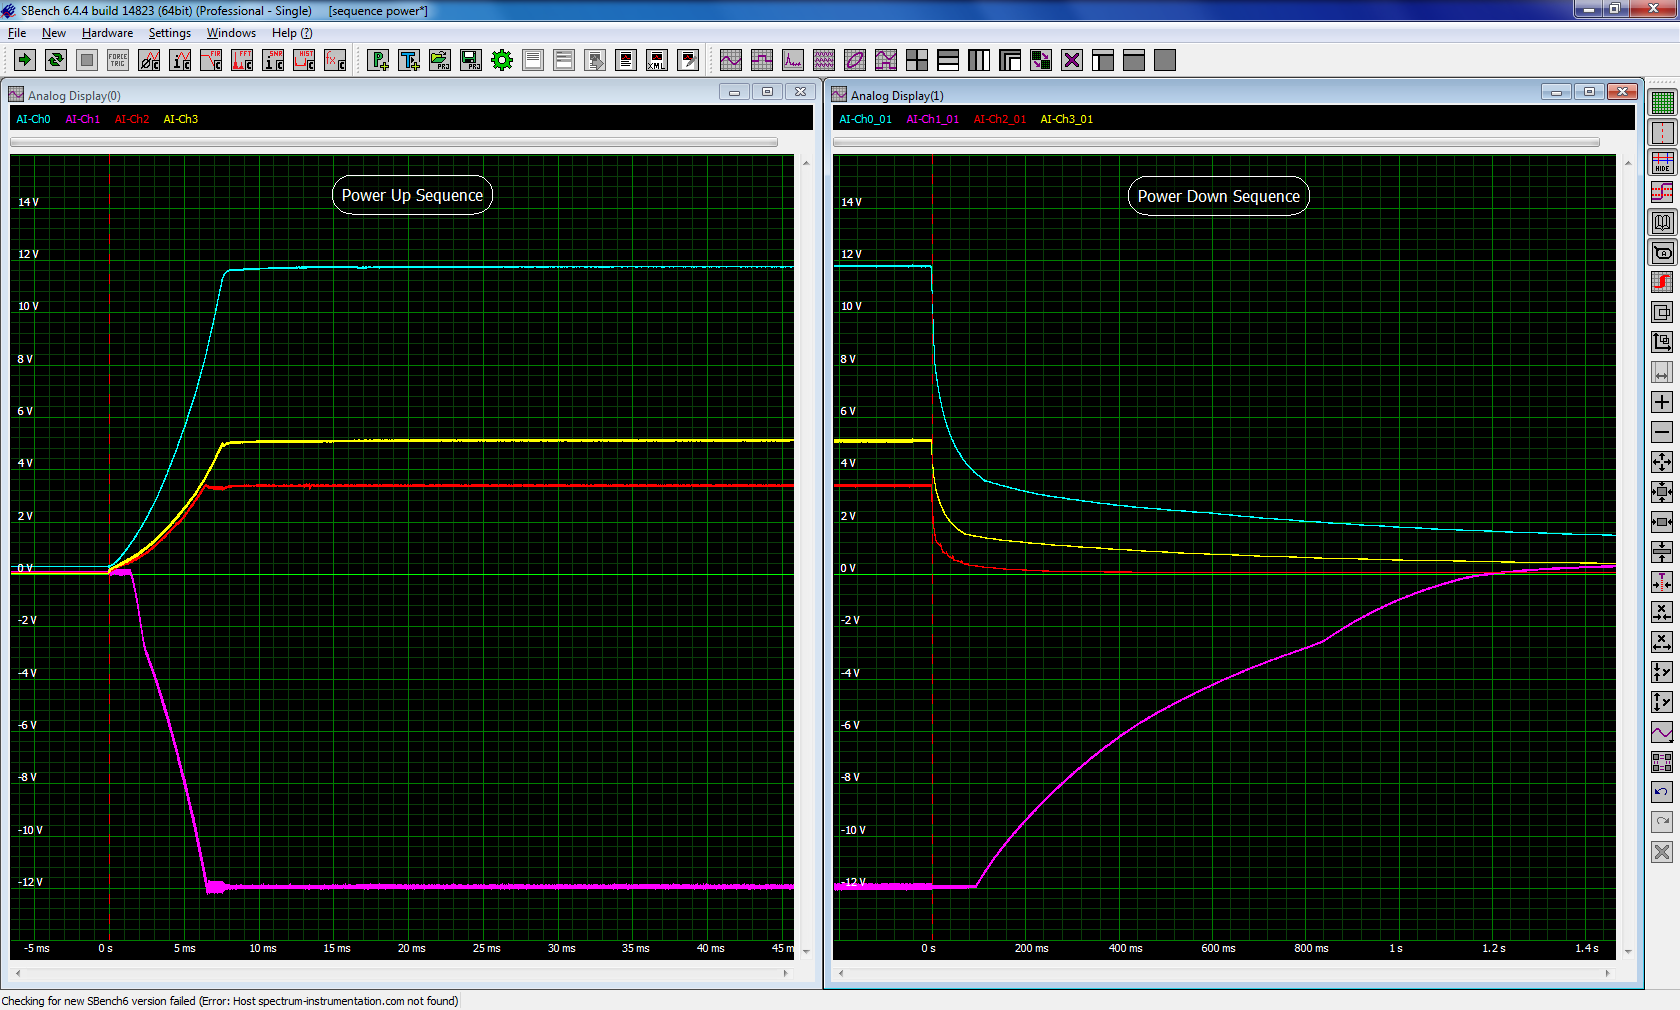 Electronic components that require multiple voltages usually are sensitive to the order in which those voltages are applied. Power supplies generally are designed to support a known and repeatable power-on sequence. With some supplies supporting six to eight different voltage rails the number of channels that can be measured at one time is important. This is another advantage of modular digitizers in that they can have 1, 2, 4, 8 or 16 channels per card and by coupling multiple cards together expand the channel count to a maximum of 256 synchronized channels. Power sequence measurements usually take tens of milliseconds and are another measurement that benefit from long acquisition memories. An example of a power up sequence measurement for the four power rails of a computer supply is shown in the left hand grid of Figure 5.
The four voltage rails are +12, -12, +5, and +3.3 volts. The -12 rail, which is very lightly loaded reaches its nominal voltage first, followed by the +3.3, +5, and +12 rails. The observed power transitions are monotonic with no obvious steps or glitches. A similar power-down sequence of the same supply is shown in the right hand grid. Here it can be observed that the -12 volt supply rail takes the longest time to decease due to its very light load. The other supplies initially decease more quickly but then approach zero asymptotically.
Modular instrument configurations
Depending on the complexity of the desired power supply test system there are several modular instrument configurations available.
The simplest is PCIe based instruments. These are intended to be installed into desktop or portable PC's and will accommodate several cards per system. PCIe digitizers offer the highest data transfer rates as high as 700 MB/s for the model used in this article.
More sophisticated systems can use a PCI eXtensions for Instrumentation or PXI based system. This requires a PXI chassis or crate and controller but can handle multiple types of PXI instruments.
For general remote access an LXI (LAN Extensions for Instruments) based system such a Spectrum's digitizerNETBOX which supports up to 48 channels of the M2p series digitizers used in this article. Controlling and accessing the data collected by the digitizerNETBOX is done by simply connecting it with Gigabit Ethernet to a host computer anywhere on a network or extended network.
All configurations are supported by Windows and Linux drivers for custom programming as well as Spectrum's SBench 6 program for "out of the box" control and analysis. MATLAB and LabVIEW support is also provided for more extensive control, processing, and analysis.
Conclusions
 Digitizers offer impressive characteristics for testing power supplies. For example, 16 bit ADCs provide high dynamic range to show small signals like ripple on the power supply rails. A comparison between 8 bit scope and 16 bit digitizer is shown in figure 6. Long acquisition memory is available for recording slow start up and shut down events with excellent time resolution. Programmable input channel configuration, single ended or differential enables current measurements on floating current shunts. Consider these advantages for your power supply testing requirements.
Downloads
- Article as pdf (english)