RF Measurements using a Modular Digitizer
Modern modular digitizers, like the Spectrum M5i and M4i series PCIe digitizers, offer greater bandwidth and higher resolution at any given bandwidth than ever before. Although they are in the class of general purpose measuring instruments they are capable of many RF and lower microwave frequency measurements. This article focuses on some examples of common RF measurements that can be performed with these modular digitizers.
Reasons to consider a digitizer for RF applications
Modular digitizers offer significant advantages in your measurement application if you need any of the following characteristics:
Do you need high measurement throughput?
Multi-lane PCIe based modular digitizers can stream data at speeds of up to 12.8 Gbytes/s allowing easy and fast processing within the computer. This allows storage of very long signals (up to hours using a disk array) for post-acquisition analysis.
Will you be troubleshooting a circuit, device, or process or making measurements that may require analysis and processing?
The modular digitizer is the best tool if you will be measuring, analyzing or processing data. The intimate tie-in of the digitizer and computer makes them the instruments of choice where large amounts of data are to be processed using either commercial or custom analysis software. While troubleshooting requires the interactive viewing capability of the other bench top instruments digitizers shine whenever automated signal characterization is necessary.
Do you need multiple channels in a small form factor with minimal power?
This is the forte of modern modular digitizers, multiple channels per card and multiple cards per system all fully synchronized. Modular platforms such as the Spectrum M4i series can extend the number of analog or digital channels and analog and pattern waveform generation capabilities. This characteristic makes digitizers ideal for multiple input multiple output (MIMO) studies as well in multichannel communications systems.
Do you need to keep the cost of ownership low?
Digitizers offer the lowest cost per acquisition channel, with ease of use, speed of integration, and reliability.
Digitizer Selection
Radio frequency measurements require digitizers with three key characteristics. The first is bandwidth. The digitizers must support a frequency range that matches the intended measurement. The next is resolution, which determines the dynamic range of the measurement. The final major consideration is data transfer speed, which affects the measurement update rate. Table 1 summarizes the characteristics of several Spectrum PCIe digitizers which are likely candidates for RF applications.
| model | Channels | Resolution | Sample rate | Bandwidth |
|---|---|---|---|---|
| M5i.3337-x16 | 2 | 12 bits | 1 x 6.4 GS/s or 2 x 3.2 GS/s | 2 GHz |
| M5i.3330-x16 | 1 | 12 bits | 1 x 6.4 GS/s | 2 GHz |
| M5i.3321-x16 | 2 | 12 bits | 2 x 3.2 GS/s | 1 GHz |
| M4i.2210-x8 | 1 | 8 bits | 1.25 GS/s | 500 MHz |
| M4i.2211-x8 | 2 | 8 bits | 1.25 GS/s | 500 MHz |
| M4i.2212-x8 | 4 | 8 bits | 1.25 GS/s | 500 MHz |
| M4i.2220-x8 | 1 | 8 bits | 2.5 GS/s | 1.5 GHz |
| M4i.2221-x8 | 2 | 8 bits | 2.5 GS/s | 1.5 GHz |
| M4i.2223-x8 | 2 | 8 bits |
1 x 2.5 GS/s or 2 x 1.25 GS/s |
1.5 GHz |
| M4i.2230-x8 | 1 | 8 bits | 5 GS/s | 1.5 GHz |
| M4i.2233-x8 | 2 | 8 bits | 1 x 5 GS/s or 2 x 2.5 GS/s | 1.5 GHz |
| M4i.2234-x8 | 4 | 8 bits | 1 x 5 GS/s or 2 x 2.5 GS/s or 4 x 1.25 GS/s | 1.5 GHz |
| M4i.4450-x8 | 2 | 14 bits | 500 MS/s | 250 MHz |
| M4i.4451-x8 | 4 | 14 bits | 500 MS/s | 250 MHz |
| M4i.4420-x8 | 2 | 16 bits | 250 MS/S | 125 MHz |
| M4i.4421-x8 | 4 | 16 bits | 250 MS/S | 125 MHz |
| M4i.4410-x8 | 2 | 16 bits | 130 MS/s | 65 MHz |
| M4i.4411-x8 | 4 | 16 bits | 130 MS/s | 65 MHz |
Each of these modular digitizers interfaces to its host computer using either a PCIe x16 interface capabale of data transfer rate up to 12.8 GByte/s or a PCIe X8 interface capable of a data transfer rate of up to 3.4 GByte/s. Other digitizer models, are available with more modest transfer rates.
Dynamic Range Measurement Example
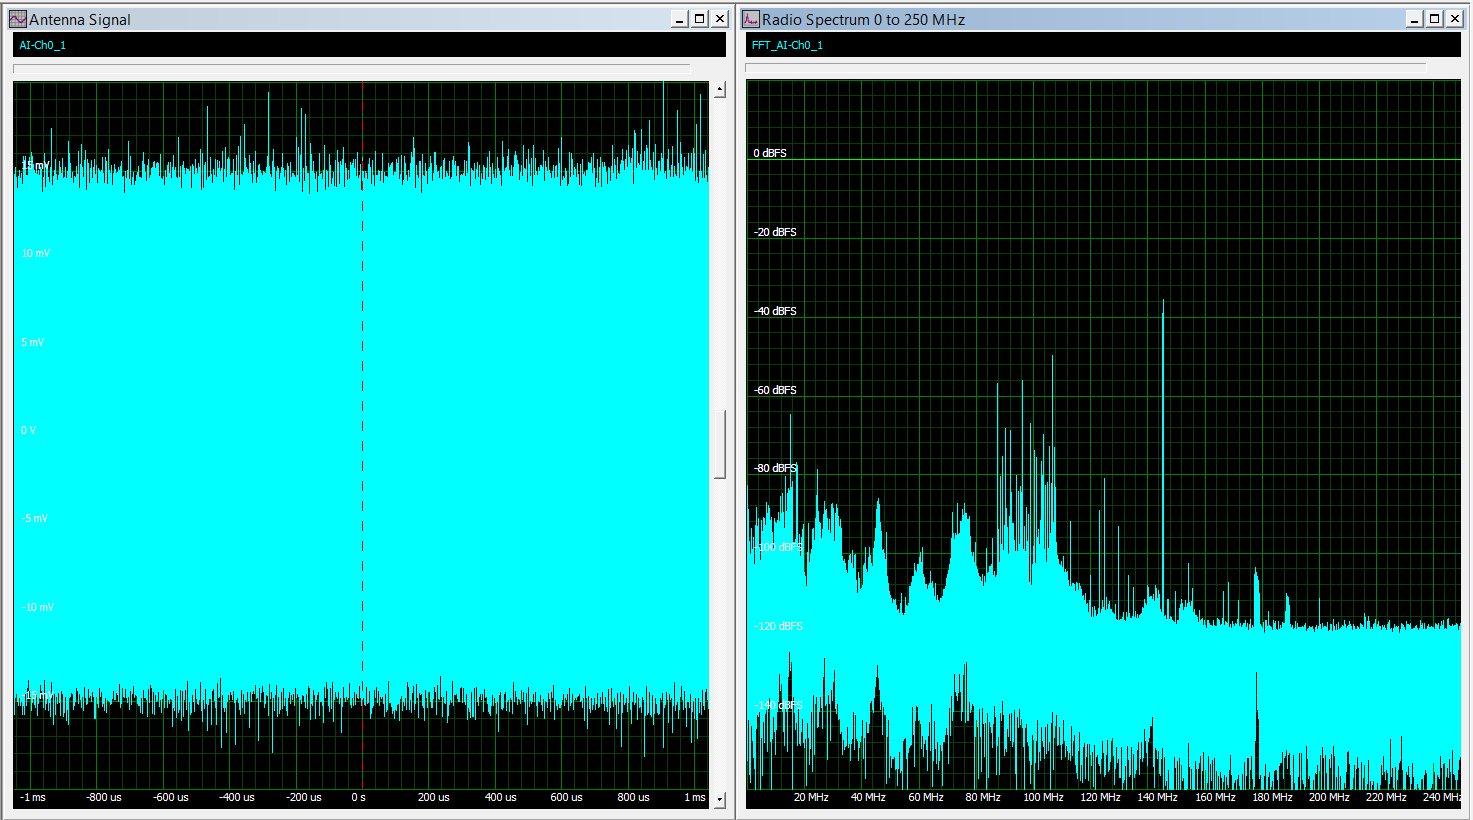 A quick review of the specifications summarized in the table reveals a tradeoff between resolution and bandwidth. The choice of a specific model is determined by the application. If the signal being measured has a small ratio of highest to lowest amplitude then a digitizer with lower resolution is acceptable. This type of application, such as characterizing a transmitted radar signal, has low dynamic range requirements. On the other hand, if the signal has a mix of high and low amplitude components then a higher resolution is required. Applications such as software defined radio (SDR), and echo location (like radar) require digitizers with large dynamic ranges. Figure 1 shows the acquired waveform resulting from connecting a simple antenna to the input of a Spectrum M4i.4450-X8 digitizer, with 14 bit resolution, as displayed and processed using Spectrums SBench 6 software. Both the time and frequency domain views of the waveform are shown. This is an example of a high dynamic range signal.
The acquired signal, shown in the left hand grid, has a 38 mV peak to peak amplitude. Although it appears noise-like, the Fast Fourier Transform (FFT), displayed in the right grid, shows that the wide dynamic range of the digitizer is picking up multiple RF sources. The highest peak is a 145 MHz signal with an amplitude of approximately -36 dBFS (dB relative to full scale). The FM broadcast band from 88 to 108 MHz shows a station with the peak amplitude of -50 dBFS. The peak noise floor amplitude is about -120 dBFS. The 14 bit digitizer has a dynamic range of approximately 85 dB. The large FFT transform (500k points) contributes significant processing gain which provides the additional dynamic range shown in this example.
RF Measurements
 Digitizers acquire data and make it available for measurement and analysis. Measurement and analysis are performed using software. In these examples Spectrum's SBench 6 is being used to perform the tasks. Third party software such as Mathworks MATLAB or National Instruments LABVIEW can also be used. Similarly, custom software can be written for specific measurement and analysis operations. In all cases driver software, mating the digitizers to specific application programs is available.
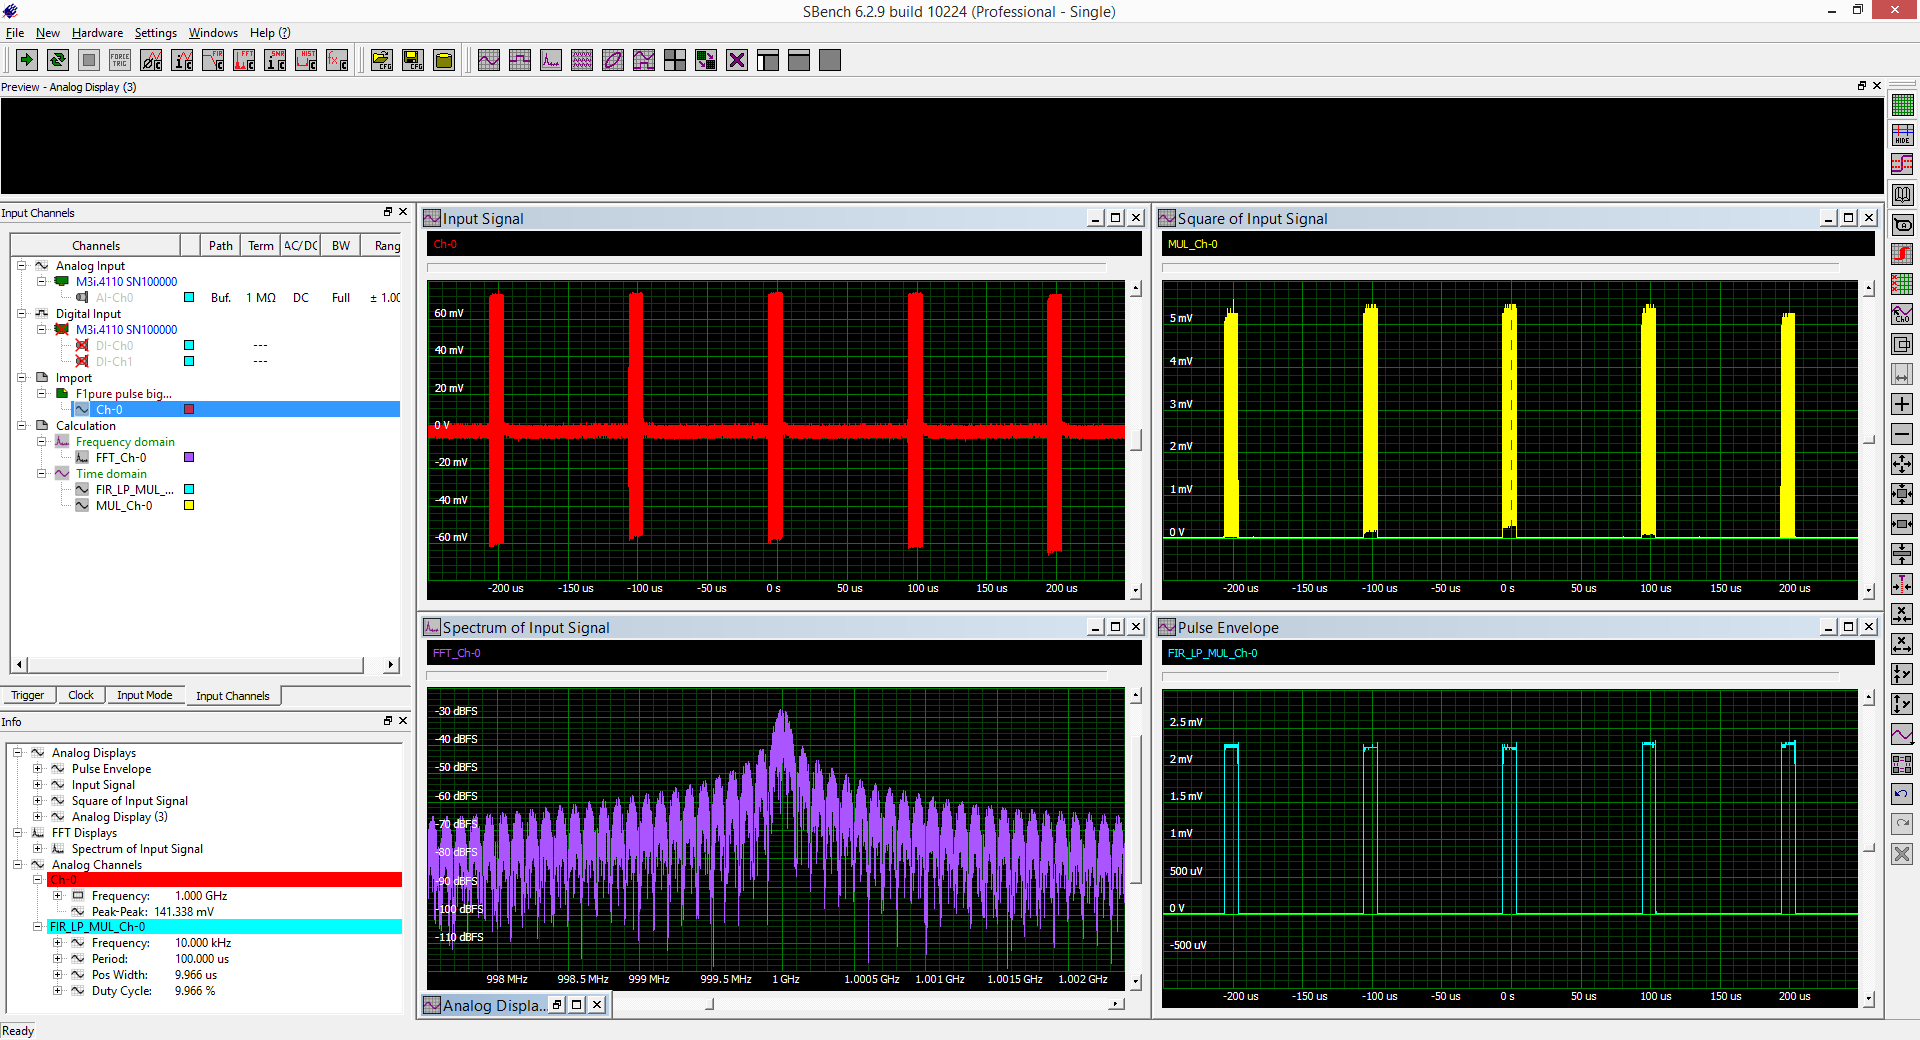
Some basic RF measurements are shown in Figure 2. Again, SBench 6 is being used for this example.
The acquired waveform, shown in the upper left grid, is a pulse modulated 1 GHz sinewave common in radar applications. This signal was input directly into the digitizer but it can also be input from a down converter if its frequency is above the bandwidth of the digitizer. The FFT, in the lower left grid, shows the spectrum of the acquired waveform. SBench 6 includes a large number of built-in measurement parameters. The Info pane, in the left center of the figure, lists measurements of the acquired waveforms peak to peak amplitude and frequency. Analysis of the pulse timing requires further processing to extract the signal envelope. This is accomplished in two steps. First, the waveform is squared using basic analog calculation to take the product of the acquired waveform with itself. The squared waveform is shown in the upper right grid. The squared signal is now filtered with a digital low pass filter with a cutoff frequency of 10 MHz. This removes the residual 1 GHz carrier producing the desired pulse envelope. The measurements of pulse frequency, period, width and duty cycle are shown in the Info pane associated with the pulse envelope.
SBench 6 provided the tools to perform a square-law detection of the amplitude modulated waveform allowing direct measurements of the pulse waveform parameters. More complicated demodulation processes are offered by MATLAB or LABVIEW used in conjunction with the modular digitizer. This would permit frequency and phase demodulation of radar "chirp" and Barker encoded signals.
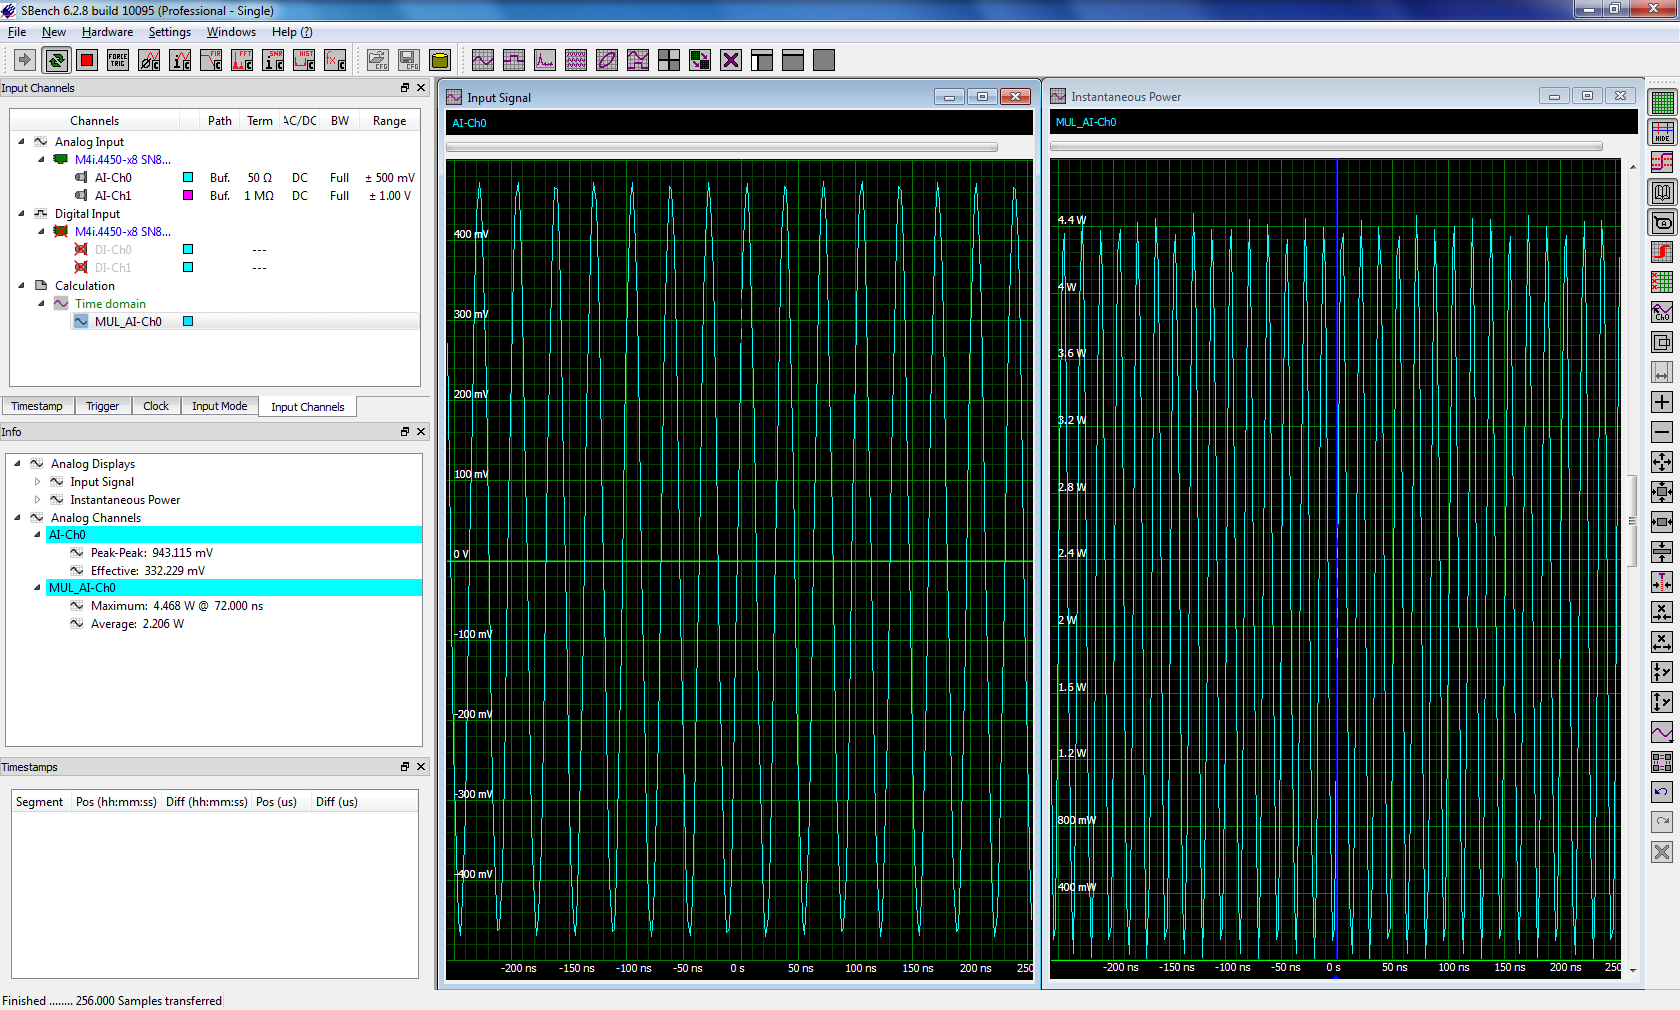 Let's look at some basic power measurements. The square of the acquired signal will again be used to compute the instantaneous power for the waveform. The squared voltage will be scaled to divide it by the 50 Ohm impedance resulting in a display calibrated in Watts. Parameters, applied to this waveform, will calculate the average power of the signal. The process is shown in Figure 3.
The acquired sine wave is shown in the grid on the left. Parameters, shown in the Info pane on the left, read the peak to peak and effective (RMS) amplitudes of the sine signal. The input signal is squared by again applying the multiply calculation function to it. The resultant waveform is then scaled in amplitude using the signal settings control. This allows the user to rescale the display in user defined units. Data is scaled by dividing the vertical readings of the squared waveform by the impedance of 50 Ohms.
The result is shown in the right hand grid. The vertical units are milliwatts (mW). This display is the instantaneous power of the source. Referring again to the Info Pane there are two parameters applied to measuring this waveform. The first is the maximum. This records the peak power observed. The second is the average value of the power waveform. This is the average or mean power.
The accuracy of these measurements depends on several factors. The most important is the flatness of the frequency response of the digitizer. Most broadband digitizers try to hold the frequency response flatness to within 0.5 dB. This works out to be about a 5% voltage uncertainty at the maximum. Corrections can be applied if greater accuracy is required.
Multi-channel Acquisition and Analysis
Quadrature Modulation Signals
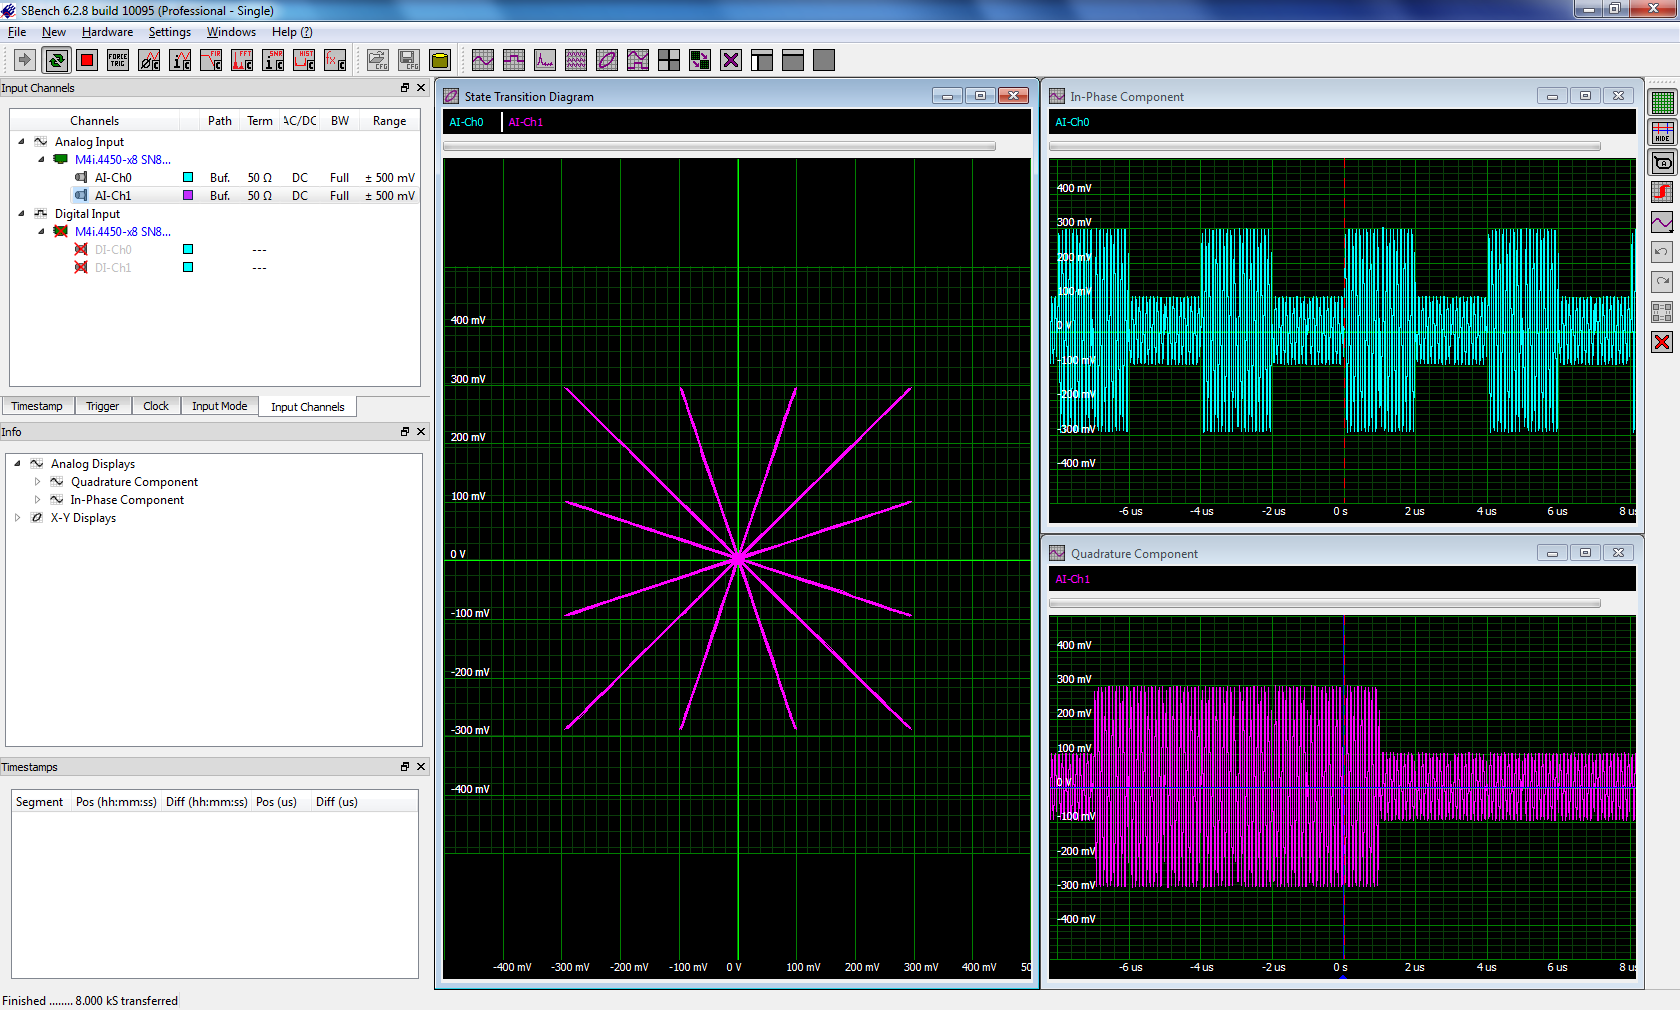 The RF world offers many opportunities for multi-channel analysis. Perhaps the most common is the analysis of quadrature modulated signals. The baseband in-phase (I) and quadrature (Q) components are combined in order to modulate an RF carrier. Modulation may be simple phase modulation or a combination of phase and amplitude modulation. Figure 4 shows the acquisition of the I and Q components of a 16 state quadrature amplitude modulated (16 QAM) signal. In this modulation scheme two serial data streams are combined to transmit four data states with each of the sixteen transmitted symbol states.
The two right hand grids show the acquired I and Q components. If these components are cross plotted in an X-Y plot we can discern the sixteen amplitude/phase states that are the complement of this signal encoding. There are twelve distinctive phase states and four additional states that use the same phases at 45, 135, 225 and 315 Degrees but with reduced amplitude.
Frequency Response Measurements
The frequency response of a circuit or device can be estimated easily using two digitizer channels and a broadband signal source. There are three types of signals that exhibit uniform amplitude over a range of frequencies. Swept Sine, impulse, and white noise each have a spectral response that is uniform over a range of frequencies. Swept sine offers the greatest dynamic range. The impulse function is generally the easiest to setup and use. White noise, due to its high peak to effective amplitude ratio, has the lowest dynamic range. Figure 5 is an example of a frequency response measurement of a 36 MHz low pass filter. The signal source used is an impulse function from an arbitrary waveform generator (AWG) with a bandwidth of 125 MHz.
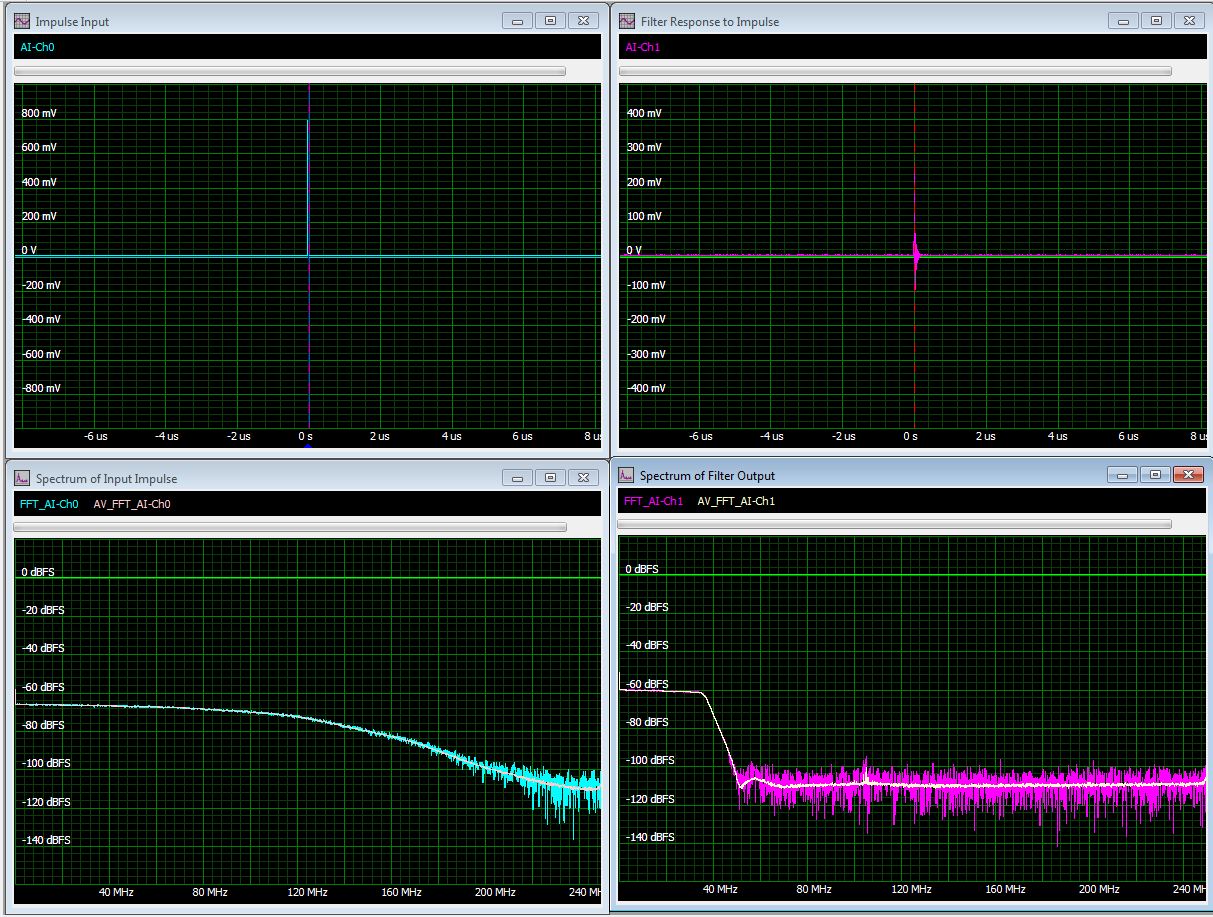 The impulse function is shown in the upper left grid, below it is the FFT of this input signal. The spectral shaping is due to the output response of the AWG as well as the limited transition time of the impulse function. Note that the spectrum is relatively flat out to 50 MHz which is adequate for this example. The waveform in the upper right grid is the output of the filter. Its FFT is in the lower right grid. Here we can see the shape of the filter response. Cursors can be used to estimate the -3dB point and measure the bandwidth.
These are two simple examples of RF measurements based on multi digitizer channels. They make use of the fact that data acquisition on multiple channels is totally synchronous. The concept can be expanded to multiple digitizers linked together with a Star-Hub. This is an additional module offers phase stable synchronization of up to eight boards of a kind in one system. For example, connecting eight M4i series digitizers together with Star-Hub lets you create a system with up to 32 fully synchronized channels. The Star-Hub distributes trigger and clock information between all boards. As a result all connected boards are running with the same clock and the same trigger with no phase delay between any of the channels. All trigger sources can be combined with a logical OR allowing all channels of all cards to be a trigger source at the same time.
This multi-channel capability allows digitizers to be applied to multiple communications channels simultaneously or to create arrays of measurement channels for antenna and propagation studies.
Modular digitizers offer significant measurement capabilities in RF applications with bandwidth up to 1.5 GHz. Their versatility, compact size, and multichannel capabilities can be combined into powerful test systems for your RF applications.
Links