Amplitude resolution is a key specification for digitizers. How is this specification matched to the measurement requirement? What are the technical tradeoffs involved in the selection of digitizer amplitude resolution? Having made such a selection what can be done to improve the resolution of the acquired data? These are all common questions to answer about digitizers or other digital instruments.
Amplitude Resolution
Amplitude resolution specifies the vertical precision of the digitizer. The quantization of a signal in a digitizer is controlled by its analog to digital converter or ADC. The resolution of the ADC is the number of bits it uses to digitize the input samples. The amplitude resolution specification is usually expressed as a number of bits; for instance, 8-bits or 16-bits.
A digitizer with 8-bits of amplitude resolution breaks the digitizer's input amplitude range into 28 or 256 levels. Similarly, a 16-bit digitizer uses 216 or 65,535 quantization levels. It is obvious that the greater the resolution the finer the quantization of the input voltage range. However, amplitude resolution is linked to the digitizer's maximum sampling rate and also the maximum input bandwidth. Increased resolution is only available at the cost of decreased maximum sampling rate and bandwidth.
Consider three different digitizers from Spectrum the M4i.4451-x8, M4i.2234-x8, and the M2p.5966-x4 shown in table 1:
| Model Number | Amplitude Resolution (bits) | Maximum Sample Rate (MS/s) | Bandwidth (MHz) | Dynamic range |
|---|---|---|---|---|
| M4i.2234-x8 | 8 | 5000/2500/1250 | 1500 | 256:1 |
| M4i.4451-x8 | 14 | 500 | 250 | 16374:1 |
| M2p.5966-x4 | 16 | 125 | 60 | 65536:1 |
From this example it can be seen that the amplitude resolution is inversely proportional to the maximum sampling rate, the greater the amplitude resolution the less the maximum sampling rate and bandwidth. The maximum possible bandwidth is the Nyquist limit of one half the sample rate. A digitizers actual analog bandwidth can differ from this but is generally proportional.
Dynamic Range
Digitizers operate over a set of selectable input voltage ranges (commonly called the full-scale range) which set the maximum voltage that can be applied without clipping the input waveform. The minimum voltage that the digitizer can discern theoretically is the maximum voltage divided by the number of quantization levels. So, an 8-bit digitizer with a full-scale range of 1 volt can distinguish a level of 1/256 or 3.9 mV; while a 16-bit digitizer on the same range can discern a level of 1/65536 or 15.2 µV. This difference is significant if the signals being measured span the full amplitude range of the digitizer. Measuring a small signal in the presence of a larger signal requires a greater dynamic range. For example, measuring 1 mV of ripple on a 5-volt power supply requires a dynamic range of 0.001/5 = 2*10-4 or greater than 5000 to 1.
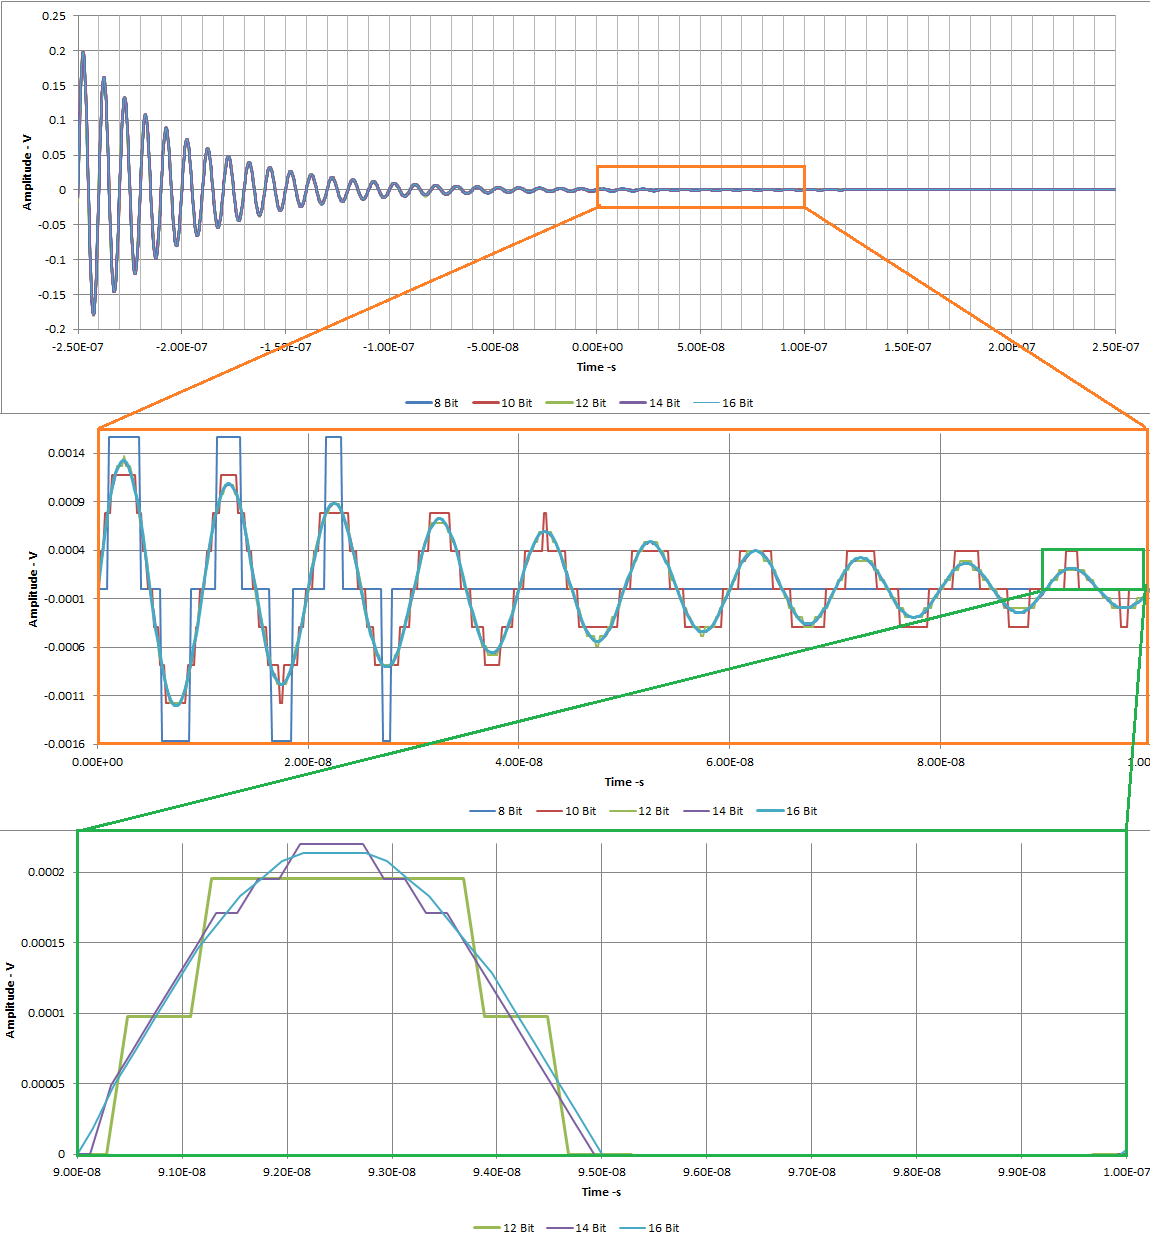
 To see how amplitude resolution affects waveform digitalization observe Figure 1. The damped sine is a waveform with a high dynamic range. It is applied to the ±200 mV range of five ideal digitizers with amplitude resolutions of 8-, 10-, 12-, 14-, and 16-bits. The top display shows the digitizer responses overlaid. There are no obvious differences.
By magnifying the section from 0 to 1E-7 seconds greater detail emerges as seen in the center grid. On the left side the 8-bit digitizer is near the limit of its dynamic range as indicated by it switching a single bit resulting in the pulse-like appearance. Moving to the right observe that same thing occurs to the 10-bit digitizer starting around 5E-8 seconds. Zooming in on the last cycle in this grid the bottom grid view is obtained. The 10-bit trace has been removed. The difference between the 12-, 14-, and 16-bit digitizer results show the obvious quantization steps of the 12- and 14-bit digitizer outputs. The observation is that higher amplitude resolution yields a better representation of the waveform. This assumes that the measurement bandwidth is adequate to allow the measurement without significant attenuation.
What are the Restrictions on Achieving Maximum Amplitude Resolution?
Digitizers, like all electronic measurement instruments, have a number of error sources which prevent attainment of the ideal amplitude resolution. These error sources can be classified in two broad categories: noise and distortion.
Distortion is a deterministic error that is correlated to the input signal. A common form of distortion is harmonic distortion. As the name implies it occurs with spectral components at frequencies that are integer multiples of the input frequency. Harmonic distortion arises due to non-linearities in the digitizer circuits. Causes can be saturation, clipping, slew rate limitations and others. Digitizer topologies that interleave multiple ADC's to achieve higher sampling rates add distortion due to mismatches in the gain and offsets of each ADC. This type of distortion is termed interleaving distortion.
 Noise is a random signal that is not related to the input signal of the digitizer. Noise is categorized by its probability density function (pdf) using histograms. A common noise classification is Gaussian or Normally distributed noise which has a pdf which follows a Gaussian or bell-shaped distribution. There are many electronic sources of Gaussian noise. Another noise associated with the analog to digital conversion process is quantization noise. Quantization noise is the "round off" error, the difference between the analog input signal and the digital estimate of the digitizer. Quantization noise has a uniform distribution with equal probability of occurrence across its pdf.
In the frequency domain noise can be considered error components that do not occur at the signal frequency or any of its harmonics. It is generally broadband. Noise that is spectrally spread evenly over all frequencies is referred to as "white" noise. Both Gaussian and quantization noise have this characteristic.
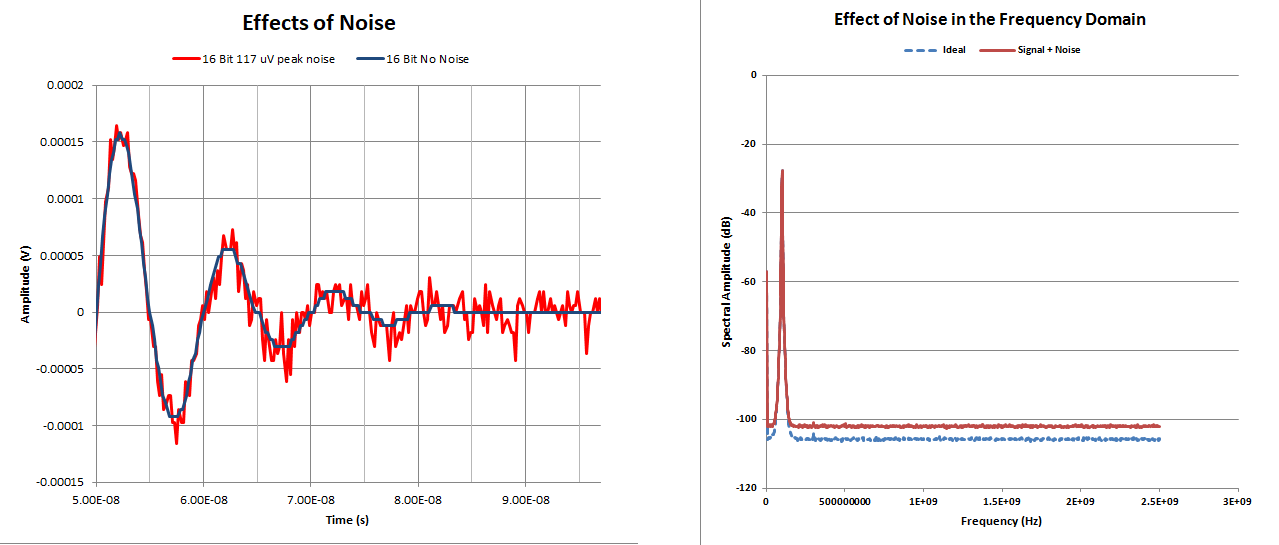
Designers make every effort to minimize noise and distortion in digitizer circuits. Both types of errors tend to reduce the effective amplitude resolution of the digitizer. Figure 2 provides an example of the effect of noise on the output of a 16-bit digitizer. The effects can be viewed in both the time and frequency domains. In the time domain display on the left in the figure an ideal 16-bit digitized waveform (blue trace) is overlaid by the same waveform with 117 µV of Gaussian noise added (red trace). The noise spikes obscure the quantization steps on the ideal waveform greatly reducing the effective amplitude resolution.
In the frequency domain view, on the right in the figure, observe that the spectral shape of the noise free (blue trace) and noise added (red trace) differ primarily in the baseline offset. The broad band, white noise component is spectrally spread and raises this baseline.
Harmonic distortion adds error components that are synchronous with the input signal. This results in changes in the instantaneous phase of the time signal. The frequency spectrum of a signal with harmonic distortion will contain harmonics that are not in the original signal.
Figures of Merit for Comparing the Quality of Digitizers
Figures of Merit are common measurements which facilitate the comparison of different instruments, in this case digitizers. Common figures of merit for the amplitude performance of digitizers are summarized in Table 2.
| Figure of Merit | Abbreviation | Analysis Domain | Description |
|---|---|---|---|
| Baseline Noise | Time | RMS noise level, expressed in Volts, with no signal applied. | |
| Total Harmonic Distortion | THD | Frequency | The ratio of the RMS sum of the significant harmonics to the RMS value of the fundamental expressed in dB |
| Signal to Noise Ratio | SNR | Frequency | The ratio of the RMS signal amplitude to the RMS sum of all other spectral components other than distortion and offset error expressed in dB |
| Signal to Noise and Distortion Ratio | SINAD or THD+N | Frequency | The ratio, expressed in dB, of the RMS signal to the RMS sum of all other spectral components, including the harmonics except DC |
| Effective number of Bits | ENOB | Frequency | ENOB is the number of bits in a digitizer that produces the same SINAD value as a system whose only source of noise is quantization itself. |
These figures of merit are defined in IEEE Standards 1057 and 1241. Most digitizer suppliers specify these values in their data sheets. When comparing digitizers using these figures of merit, make sure that they are specified for the same input frequency, input amplitude, sample rate, and bandwidth.
Table 3 lists the key dynamic specifications for the Spectrum PCIe digitizers with amplitude resolutions of 8-, 14-, and 16-bits. Note that the baseline noise varies proportional to bandwidth. This is expected based on the physical nature of noise. As the amplitude resolution becomes finer, the noise in proportion to the least significant bit (lsb) becomes greater. This is because the noise level, except for quantization noise, is fixed by the circuit configuration and is not related to the digitizer's resolution. This is why the ENOB does not improve dramatically with increasing number of bits of amplitude resolution.
| Dynamic Specification | M4i.2234-x8 | M4i.4451-x8 | M2p.5966-x4 |
|---|---|---|---|
| Amplitude Resolution (bits) | 8 | 14 | 16 |
| Max Sampling Rate (MS/s) | 5000 | 500 | 125 |
| Bandwidth (MHz) | 1500 | 250 | 60 |
| Voltage Resolution at ±1 V range (µV) | 7800 | 122 | 35 |
| RMS Baseline Noise (lsb) | <0.3 | <1.9 | <5.5 |
| RMS Baseline Noise (µV) | <2300 | <232 | <168 |
| THD (dB) | <-60.3 | <-75.8 | <-68.7 |
| SNR (dB) | >44.8 | >67.9 | >72.7 |
| ENOB (bits) | >7.1 | >10.9 | >11.0 |
Minimizing the Effects of Noise and Distortion
Minimizing the effects of noise and distortion is primarily the function of the digitizer designer. Non-linearity, harmonic distortion, and other sources of distortion must be reduced in the design. Noise reduction depends on component selection, optimizing gain distribution and circuit layout.
The user has little control over reducing distortion other than not overdriving the digitizer. The user has some control over minimizing the effects on noise. Here are some simple tips:
- Maximize the signal being analyzed in the input range of the digitizer. This maximizes the signal to noise ratio.
- Digitizers with multiple ranges make this easier but make sure the noise level doesn't scale with input attenuation.
- Use the minimum measurement bandwidth consistent with the application. White noise has a fixed power per unit bandwidth and the total noise level is proportional to bandwidth. This can be implemented using input bandwidth limiting or with digital filtering.
- Use signal processing such as averaging to reduce the noise level proportional to the number of measurements averaged. Keep in mind that summation averaging requires a repeatable signal and multiple acquisitions. A moving or boxcar average can be applied to single shot measurements.
- For low level signals use external low noise amplifiers to boost signal level and maximize signal to noise ratio.
- Use the proper termination in the complete signal path. The 50 Ω termination is a good choice in that it provides the highest available bandwidth and matches the impedance of the signal source, and cabling.
Measurement Example
Digitizers with a large dynamic range and hence greater resolution are required for applications where both high and low amplitude signal components are present at the same time.
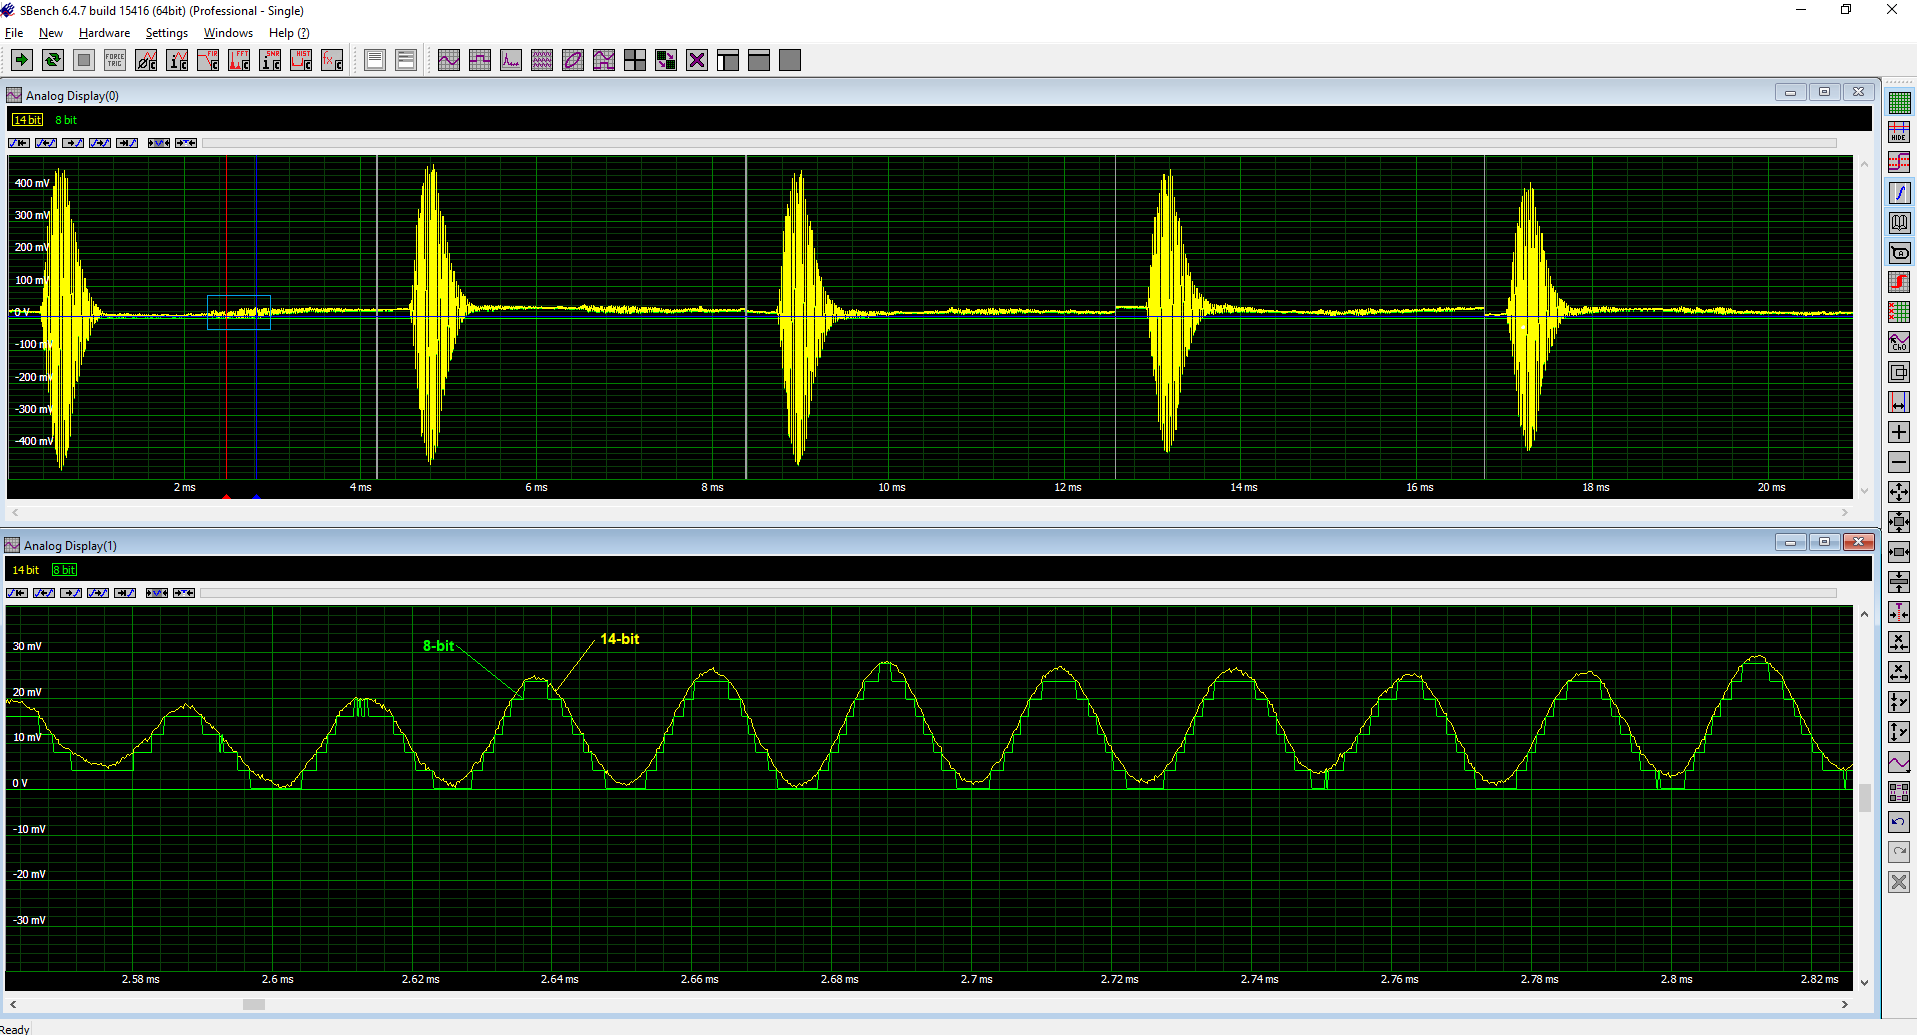
Radar, sonar, lidar, ultrasound, and medical imaging are all echo ranging applications where a high amplitude transmitted signal is followed by an echo signal with a much lower amplitude. A digitizer must be capable of accurately handling both amplitude signals. Consider the ultrasonic measurement shown in Figure 3.
 The ultrasonic range finder emits a series of five 40 kHz bursts, an echo from the target returns about 2ms after each pulse burst. The echo is attenuated by about 33 dB. The upper trace displays the full acquisition showing all five bursts. In addition to the 14-bit acquisition a simulated 8-bit acquisition is overlaid for comparison. There is no visible difference in the upper trace. The lower trace is an expanded or zoom view of a segment of the first echo. The source location is marked by the red and blue cursors in the upper trace. In the zoom trace the difference between the 14-bit (yellow trace) and 8-bit (green trace) digitalization is very apparent with the 8-bit version showing significant quantization. The 8-bit resolution would be adequate if the measurement was only interested in the echo location in time. If amplitude or phase details were being measured, then the 14-bit resolution would be required.
Conclusion
Using the highest amplitude resolution possible is always the best choice if measurement bandwidth is not a limiting issue. If a trade-off must be made, then bandwidth should be the first decision to be made when selecting a digitizer. Amplitude resolution should come next to assure adequate sensitivity. Keep in mind that digitizers also offer additional signal processing capabilities such as averaging and filtering which can often improve dynamic range.
Downloads
Article as pdf (english)